REPORT B OARD OF E DUCATION OF H OWARD C OUNTY M EETING A GENDA I TEM - - PDF document

report
SMART_READER_LITE
LIVE PREVIEW

REPORT B OARD OF E DUCATION OF H OWARD C OUNTY M EETING A GENDA I TEM - - PDF document

REPORT B OARD OF E DUCATION OF H OWARD C OUNTY M EETING A GENDA I TEM Presentation of the Attendance Area Adjustment Plan T ITLE : D ATE : October 3, 2017 Michael J. Martirano, Ed.D. Interim Superintendent P RESENTER ( S ): O VERVIEW : This


slide-1
SLIDE 1

BOARD OF EDUCATION OF HOWARD COUNTY MEETING AGENDA ITEM

TITLE: Presentation of the Attendance Area Adjustment Plan DATE:

October 3, 2017

PRESENTER(S):

Michael J. Martirano, Ed.D. Interim Superintendent

OVERVIEW:

This document contains attendance area adjustment recommendations for the school year 2018–2019. Attendance area adjustments are recommended at the elementary and middle school levels involving the following schools: Bellows Springs ES, Bryant Woods ES, Bushy Park ES, Clarksville ES, Clemens Crossing ES, Dayton Oaks ES, Deep Run ES, Ducketts Lane ES, Lisbon ES, Longfellow ES, Manor Woods ES, New ES #42, Pointers Run ES, Rockburn ES, Running Brook ES, St Johns Lane ES, Triadelphia Ridge ES, Waterloo ES, Waverly ES, West Friendship ES, Burleigh Manor MS, Clarksville MS, Elkridge Landing MS, Folly Quarter MS, Harpers Choice MS, Lime Kiln MS, Mayfield Woods MS, Mount View MS, and Wilde Lake MS. This recommendation follows the June 2017 Feasibility Study and evaluation by the 2017 Attendance Area

  • Committee. The annual Feasibility Study is a study of long term capital planning and redistricting options.

The Attendance Area Committee is appointed in conformity with Policy 6010 School Attendance Areas to advise and comment on capacity needs and attendance area adjustment recommendations developed by staff. Taken as a whole, this review process includes short-term and long-term considerations and allows systemwide needs and options to be discussed in a transparent manner.

RECOMMENDATION/FUTURE DIRECTION:

Following a series of public hearings and work sessions beginning on October 26, 2017, the Board will be asked to approve the 2018–2019 attendance area adjustments on November 16, 2017.

SUBMITTED BY: APPROVAL/CONCURRENCE: Bruce Gist Executive Director, Capital Planning and Operations

Michael J. Martirano, Ed.D. Interim Superintendent

Renee Kamen Manager, School Planning

Karalee Turner-Little Assistant Superintendent for Administrative Affairs Anissa Brown Dennis Chief Operating Officer

REPORT

slide-2
SLIDE 2

Attendance Area Adjustments

Superintendent’s Recommendations Proposed for: School Year 2018-2019 October 3, 2017

Howard County Board of Education Cynthia L. Vaillancourt, Chairman Bess Altwerger, Ed.D., Vice Chairman Kirsten Coombs Christina Delmont-Small Mavis Ellis Sandra H. French Ananta Hejeebu Anna Selbrede, Student Member 2017-2018 Contributors: Office of the Superintendent Division of School Management and Instructional Leadership Division of Academics Division of Operations Office of School Planning Office of Transportation For information contact: Renée M. Kamen, School Planning Manager 10910 Clarksville Pike Ellicott City, MD 21042 410-313-7184

slide-3
SLIDE 3

Table of Contents

I. Introduction ............................................................................................................................ 1 II. Executive Summary ............................................................................................................... 2

  • III. Policy 6010 School Attendance Area .................................................................................... 3
  • IV. Process and Schedule

............................................................................................................ 4

  • V. 2017 Feasibility Study ........................................................................................................... 5
  • VI. Attendance Area Committee Process

..................................................................................... 6

  • VII. FY 2019 Superintendent Proposed Capital Budget ............................................................. 10

VIII. Public Participation and Input .............................................................................................. 11

  • IX. Superintendent Recommended Attendance Area Adjustments ........................................... 14
  • X. Specific Geographic Recommendations for August 2018

................................................... 15

  • XI. Maps

..................................................................................................................................... 18

  • XII. Evaluation of 2018 Attendance Area Adjustment Recommendations ................................ 27

XIII. .Pre- and Post-Measures........................................................................................................ 41

slide-4
SLIDE 4

I. Introduction

This document contains a description of the attendance area adjustment process and the Superintendent’s recommendations for attendance area adjustments for the 2018-2019 school

  • year. At the writing of this document, no decisions have been made on any attendance area

boundary changes. The Board of Education (Board) is the decision-making body for all changes in school attendance areas. The Board’s approval of attendance area adjustments is scheduled for November 16, 2017. Opportunity to provide official public testimony to the Board begins after the presentation of this document to the Board on October 3, 2017. The attendance area process includes the study of projected enrollment data, attendance area adjustment scenario testing, public participation and the assessment of scenarios against the policy standards listed in Policy 6010. The capital budget and attendance area adjustment processes work together aiming to address the long-range planning issues identified in the annual feasibility study. The 2017 Feasibility Study was presented to the Board of Education on June 22, 2017, and presented the enrollment projections and one proposed scenario of future attendance area adjustments. In September, new initiatives were introduced in the FY 2019 Superintendent’s Proposed Capital Budget. This year’s capital improvement program provides for student capacity, renovations, and various

  • ther improvements that staff, parents, and community leaders have identified as needed. The FY

2019 Capital Budget review and approval process will end with the Board of Education’s Approved Capital Budget in May 2018. The following report describes the attendance area process, including implications of the FY 2019 Capital Budget and the Superintendent’s proposed attendance area adjustments.

1

slide-5
SLIDE 5

II. Executive Summary

The Howard County Public School System (HCPSS) is opening New ES #42 in September 2018. The school was planned and is under construction to address continued enrollment growth in Howard County, especially in the northeastern region of the county. Attendance area adjustments are necessary to open the school with a geographical attendance area. This document contains recommendations for elementary and middle school attendance area adjustments that are under consideration for the Board’s review. High school boundary adjustments are not recommended at this time, since the opening of the New HS #13 has been proposed for two years earlier and programmatic changes include dual enrollment programs at Oakland Mills HS and River Hill HS. A final decision by the Board is scheduled on November 16, 2017, and would take effect in September 2018. In alignment with the HCPSS Strategic Call to Action, the attendance area adjustments and the Capital Budget provide a framework for educational facilities that give all students and staff equitable opportunities to learn and achieve. The Superintendent’s Proposed Capital Budget includes capacity for the development of new Regional Programs. Also, a new MS/HS Career Development Center, the acceleration of New HS #13 and addition of new capacity in the Hammond HS renovation project are highlights in the budget. These projects are proposed to help alleviate overcrowding. After the June 2017 Feasibility Study was published, the Attendance Area Committee (AAC) developed a scenario that was similar in scope to the June 2017 Feasibility Study, but different in a few key areas. The AAC plan proposed movement of about 6,400 students (elementary, middle and high school students) 2,400 fewer students than the Feasibility Study scenario. The final Superintendent’s plan incorporates additional community input gathered via the web or in regional meetings, and proposes moving approximately 2,200 elementary and middle school students. The proposed elementary school attendance area plan includes the opening of New ES #42, balancing capacity utilization in the Northeastern region and providing needed relief to crowded elementary schools such as Ducketts Lane ES. Additional relief is provided in the Northern and Columbia West regions using available capacity in the Western region. Included with the Superintendent’s plan are proposed middle school adjustments to align feeds in conjunction with recommended moves at the elementary school level. The Superintendent’s plan makes use of some recommendations from the AAC. The Superintendent’s plan departs from the AAC plan primarily in scope, since this plan makes use

  • f programmatic changes at the high school level. This plan reduces the number of students

moved, focusing on opening New ES #42 and minimizing the creation of new small elementary/middle school feeds. The goal of this plan is to balance capacity by moving minimal number of students and without substantially impacting other policy considerations negatively.

2

slide-6
SLIDE 6
  • III. Policy 6010 School Attendance Areas

Per standards in Board of Education Policy 6010 School Attendance Areas, the Board will consider attendance area adjustments under certain conditions. While these conditions include

  • pening a school or adjusting to some other change, the most likely prompt is when school’s

projected capacity utilization falls outside the target utilization range of 90–110 percent over a period of time. When boundary adjustments are considered, Policy 6010 School Attendance Areas identifies fourteen factors to be considered in the development of plans:

  • 1. Efficient use of available space. For example, maintain a building’s program capacity

utilization between 90% and 100%.

  • 2. Long-range enrollment, capital plans and capacity needs of school infrastructures

(e.g., cafeterias, restrooms and other shared core facilities).

  • 3. Fiscal responsibility by minimizing capital and operating costs.
  • 4. The number of students that walk or receive bus service and the distance and time

bused students travel.

  • 5. Location of regional programs, maintaining an equitable distribution of programs

across the county.

  • 6. Feeds that encourage keeping students together from one school to the next. For

example, avoiding feeds of less than 15% at the receiving school.

  • 7. Areas that are made up of contiguous communities or neighborhoods.
  • 8. Frequency with which any one student is reassigned, making every attempt to not

move a student more than once at any school level or the same student more frequently than once every five years.

  • 9. The racial/ethnic composition of the student population.
  • 10. The socioeconomic composition of the school population as measured by

participation in the federal FARMS program.

  • 11. Academic performance of students in both the sending and receiving schools as

measured by current standardized testing results in English Language Arts/Literacy and Mathematics.

  • 12. The level of English learners as measured by enrollment in the English for Speakers
  • f Other Languages (ESOL) program.
  • 13. Number of students moved, taking into account the correlation between the number
  • f students moved, the outcomes of other standards achieved in POLICY 6010

Section IV.B. and the length of time those results are expected to be maintained.

  • 14. Other reliable demographic indicators, when applicable.

3

slide-7
SLIDE 7
  • IV. Process and Schedule

Enrollment projections, capital planning and attendance area plans are reviewed annually. Attendance area adjustments are not implemented annually or on a specific schedule. Changes in attendance areas are approved by the Board of Education as needed based on Policy 6010. The below graphic outlines the capital budget and attendance area adjustment planning process and shows the school boundary adjustment process in the context of the capital budget. The feasibility study is presented as the capital budget is being prepared. The graphic shows that while school boundary adjustments may not take place annually, they are given consideration annually in the feasibility study. There are a number of ways to address enrollment growth. In some cases, new capacity or a capital project is the best solution. In other cases, a school boundary adjustment consistent with Policy 6010 may allow better use of existing capacity. Sometimes a change to regional program location can open capacity. Relocatable buildings can also be used to relieve overcrowding. The process is ongoing but may be tracked through the Feasibility Study and the capital budget process.

4

slide-8
SLIDE 8

The 2017 Attendance Area Adjustment schedule is as follows: 2017 Attendance Area Adjustment Schedule Date Time Meeting Spring 2017 Advertise for AAC, accept applications, interview candidates Thurs, June 22 7:30 p.m. Feasibility Study Presentation, AAC Charter Tues, June 27 7:00 p.m. AAC Meeting 1 Tues, July 11 7:00 p.m. AAC Meeting 2 Tues, July 18 7:00 p.m. AAC Meeting 3 Tues, July 25 7:00 p.m. AAC Meeting 4 Tues, August1 7:00 p.m. AAC Meeting 5 Tues, August 8 7:00 p.m. AAC Meeting 6 Tues, August 15 7:00 p.m. AAC Meeting 7 Tues, August 22 7:00 p.m. AAC Meeting 8 Tues, Sept 12 7:30 p.m. Fall Regional Meeting; Wilde Lake HS Wed, Sept 13 7:30 p.m. Fall Regional Meeting; Howard HS Tues, Oct 3 7:30 p.m. Superintendent Recommendation Presentation to the Board Thurs, Oct 26 7:00 p.m. Public Hearing I Wed, Nov 1 7:30 p.m. Work Session I Thurs, Nov 2 7:30 p.m. Work Session II Tues, Nov 7 7:00 p.m. Public Hearing II Thurs, Nov 9 7:30 p.m. Work Session III Tues, Nov 14 7:30 p.m. Work Session VI Thurs, Nov 16 7:30 p.m. Approval

V. 2017 Feasibility Study

Each year, the Board of Education reviews capital planning options and attendance area adjustment scenarios through a feasibility study. The most recent version of this document was published in June 2017. A primary theme of this report was the presentation of a feasible attendance area plan to open the forty-second elementary school in Howard County (New ES #42), which will be located adjacent to Thomas Viaduct Middle School. Another theme is the consideration for a comprehensive attendance area adjustment that would more fully use available seats across the county, especially in the west, to reduce the number of schools that are

  • utside of the target utilization range.

Specific recommendations listed in the 2017 Feasibility Study for the 2018 -2019 school year were:  Consider increasing the capacity for the Elementary School Education Specifications from 600 to 788.  Adjust elementary school boundaries to accomplish the following:

5

slide-9
SLIDE 9

 Open New Elementary School #42 for SY 2018–2019;  Utilize western school capacity to balance utilization in the north and West Columbia; and  Utilize new capacities at Waverly ES and Swansfield ES to balance utilization in northern and Western Columbia areas.  Consider options to better utilize West Friendship ES, including an interim capital investment to help defer a new elementary school in the vicinity.  Consider additional capacity in the Northern region to absorb the projected population growth.  Adjust school boundaries at the middle school level to balance capacity utilization as well as align middle school feeds (from elementary school). Continue planning for additional capacity at Dunloggin MS and Ellicott Mills MS.  Adjust school boundaries at the high school levels to balance capacity utilization and align high school feeds (from middle school). Continue to plan for HS #13. The attendance area adjustment scenario outlined in the Feasibility Study moved approximately 8,800 students (across all three levels of school) to meet the goals listed above. The 2017 Feasibility Study is available online in both English and Spanish. The June 2017 Feasibility Study enabled a discussion of alternatives by a committee of citizens appointed by and advisory to the Superintendent.

VI. 2017 Attendance Area Committee (AAC) Process

The formation of the Attendance Area Committee (AAC) is governed by Policy 6010 School Attendance Areas. The committee was comprised of 15 members, including residents from each

  • f the Howard County Public School System's planning areas. A student representative was a full

member of the committee. Applications to serve on the committee are accepted every Spring and an interview process in accordance with Policy 6010 is used to recommend members to the

  • Superintendent. Advertisements were made through HCPSS News and press releases. Members
  • f the committee were selected from a pool of more than 100 candidates.

The 2017 AAC was first convened on June 27, 2017, and meetings were held through August 22, 2017, with all meetings open to the public. The AAC developed a recommendation to the Superintendent at the completion of their August 22, 2017 meeting. The AAC also developed an alternative plan based on changes in the Superintendent’s Proposed FY 2019 Capital Budget (potential new location and open date of 2022 for HS #13) after the completion of their initial recommendation to the Superintendent. The Office of School Planning facilitated and assisted the AAC with learning the material and developing scenarios. Meeting summaries, presentations, maps, and assessments of scenarios have been posted to the HCPSS website. The meetings were open to the public, live-streamed and the video of the meetings archived at http://www.hcpss.org/school-planning/aac-process/. Howard County residents were able to share ideas through email or via a survey on the HCPSS

6

slide-10
SLIDE 10
  • webpage. At this writing, over 8,200 of comments from the community were received via the
  • internet. Online correspondence was shared with the committee for consideration.

A. AAC Proceedings In order for the AAC to be effective in making suggestions, staff provided support and data, and trained the group to use the various reports and maps to develop scenarios. In the discussion of scenarios, the committee was reminded of Policy 6010 and the guidance it provides. Training this year involved less lecture and more hands-on scenario testing. The meeting on June 27, 2017, was a training presentation with questions and answers. The group was able to review the results of each meeting through documents that were published

  • n the website. They received citizen input from the website often, sometimes multiple times a
  • week. The AAC worked in small groups testing scenarios for several meetings before joining

together as the entire group and deciding the direction of the group’s work. On August 8, 2017, the AAC developed a draft plan for Howard County residents to review for

  • feedback. While the plan was similar in scope to the June 2017 Feasibility Study, differences

included less overall movement at the elementary, middle and high school levels. It concentrated the high school movement in the north and west, minimizing impact to students in the southeast, assuming the addition of HS #13 in southeast Howard County. Middle school moves were to compliment both elementary and high school moves to minimize small and double small feeds. In the August 15, 2017, and August 22, 2017 meetings, the committee finalized their initial recommendation after receiving the public input from the online surveys and emailed scenario

  • plans. In the end, the group concluded that they would recommend a comprehensive plan that

impacted elementary, middle and high schools. The resulting contrast between the June 2017 Feasibility Study plan and the AAC plan allowed for comparison at the regional meetings (September 12 and 13). At the Interim Superintendent’s request on the September 11, 2017, presentation of the FY 2019 Capital Budget, the AAC developed an alternate plan, which was made available on September 27, 2017. B. August 22, 2017 AAC Plan The August 22, 2017 AAC plan requires moving approximately 6,400 students (at every level) or eleven percent of all students; twenty-seven percent less than students moved in the feasibility

  • study. Compared to the feasibility study at each level (ES, MS and HS), the number of students

moved at the elementary level is twenty-nine percent less, ten percent at the middle school level and twenty-nine percent at the high school level. Despite fewer moves, the AAC plan increases the average number of years that a school remains within target utilization from 4.5 years to 7.5 years – a 67 percent increase. Compared to the feasibility study, the AAC plan improves the number of years that schools are within target utilization by four percent (7.5 years versus 7.2 years). Overall, when compared to projected utilization for current attendance areas, the AAC plan increases the number of schools within target utilization as follows: 71 percent at the

7

slide-11
SLIDE 11

elementary school level, 45 percent at the middle school level and 90 percent at the high school level. The AAC plan results in two more additional small feeds than the feasibility study (19 versus 17) but overall decreases the number of small feeds from the existing condition (22). C. September 27, 2017 AAC Alternative Plan The AAC was reconvened by the Interim Superintendent to consider if any changes are necessary to the August 22, 2017 recommendation given new data was being considered for New HS #13 – a possible site located in the northeastern part of the county and opening in 2022. The AAC developed an alternative plan based on these changes. The AAC provided an executive summary describing the suggested recommendations if a site were to be in the northeast. The committee firmly believes that the AAC August 22, 2017, consensus plan is the best plan for comprehensive redistricting. It did identify possible reversions based on a 2022 new high school opening date at either the Mission Road or Landing Road site. The below description is summarized from the AAC’s submission to the School Planning Office on September 27, 2017: The AAC first identified possible attendance areas of New High School # 13 opening in 2022:  Mission Road site: Elkridge ES, Ducketts Lane ES and New ES #42.  Landing Road site: Elkridge Landing MS and Thomas Viaduct MS east of MD 100. The AAC opined that both Howard High School and Long Reach High School would see relief by sending the southern end of their attendance areas, south of I-95, to the new high school. However, if the Landing Road site were used, Howard High School would likely be relieved north of I-95 by capturing the entire Rockburn ES attendance area. If the Mission Road site were used, Long Reach High School may be relieved to [possibly] capture the Rockburn Elementary School attendance area from Howard High School. In either case, Howard High School may be relieved similarly (i.e., Rockburn ES and all attendance areas south). Assuming that Howard High School could be relieved similarly with either site, the AAC believed that there may be an opportunity to implement a common approach to defining the 2022 Howard High School attendance area. Using either site, Howard High School could retain the Ilchester ES and Phelps Luck ES attendance areas and push north into the Worthington ES attendance area. By going north to MD 103 into the Worthington ES attendance area one may anticipate relief for both Mount Hebron High School and Centennial High School attendance areas in 2022. This opportunity to relieve Mount Hebron High School and Centennial High School attendance areas in 2022, which potentially allows alternatives to the current AAC plan. When considering which polygons to prioritize, the AAC believed that Mount Hebron High School should be prioritized over Centennial High School, since Mount Hebron High School has limited opportunity to move students westward without affecting walk zones.

8

slide-12
SLIDE 12

The AAC recommended the following revisions to the August 22, 2017 Plan to potentially accommodate an alternative northeastern high school:  Revert all Mount Hebron HS to Marriotts Ridge HS moves;  Revert some of the Centennial HS to Marriotts Ridge HS moves;  Revert all Marriotts Ridge HS to Glenelg and River Hill HS moves; and  Revert or implement any Middle School and Elementary School moves necessary to support the high school reversions, with consideration to establishing strong feeds. These changes result in approximately 5,600 students moved, a reduction of 655 students from the AAC plan, 3,200 fewer students moved than the Feasibility Study, and only 10% of all

  • students. With the execution of this plan and the opening of HS #13, no high school student will

be redistricted more than once within a five-year period. The exact definition of these moves are provided in the table below: Polygon Action Justification 2154, 154,1154 Revert back to CHS Indirect relief expected from HS#13. These CHS polygons are the furthest from their potential reassignment and are HS only. 159, 1159 Revert back to St Johns Lane ES Maintains Valley Meade community integrity. 162, 1162, 160, 1160, 159, 1159, 2161 Revert back to Patapsco MS and Mt Hebron HS Indirect relief expected from HS#13. These polygons all contain walkers and should be considered first for reversion. 161, 1161 Move to Waverly ES Provides relief for SJLES, since 159,1159 are moved back. Reestablishes community integrity. This rejoins the east half of Mt Hebron neighborhood with the west half that already attends WavES. 1105, 105 Revert back to Dunloggin MS Revised data shows the move to PatMS is not necessary. 72 Move to Dunloggin MS Relieves PatMS and improves SJLES to DMS feed. 231, 229, 2229, 1231, 232, 1229, 224 Revert to Mount View MS and MRHS Indirect relief expected from HS#13. 179, 1179, 178, 1178 Revert to MRHS, MVMS, MWES Indirect relief expected from HS#13. Revised data shows ES relief can be obtained by redistricting 171, 1171 moving fewer students. 1171, 171 Move to TRES, FQMS, RHHS Provides relief for MWES and maintains feed. 3176 Move to Clarksville ES and Clarksville MS Provides relief for TRES and maintains feed. 1101 Revert back to Veterans ES Revised data shows the move to WorES is not necessary. 3035 Revert back to LRHS Revised data shows the move to OMHS is not necessary.

9

slide-13
SLIDE 13

D. AAC Feedback to HCPSS Staff The AAC was asked to provide feedback about the process. Summary notes from the August 22, 2017 meeting contain details of the committee’s feedback. The AAC focused on finding ways to improve the AAC process including better communication and training with the AAC; better methods to receive and respond to public input; identify charter responsibilities and direction more clearly; access to an online scenario testing tool; learn more about data and data analysis; ways to better digest public input; better communication with the public regarding the AAC’s roles and the process in general; and potentially having the AAC sign an agreement to be unbiased and represent the entire county.

  • VII. FY 2019 Superintendent Proposed Capital Budget

The Superintendent’s Proposed FY 2019 Capital Budget realized new initiatives and updated existing projects. Changes from the prior year’s budget include  Move the opening date of New HS #13 to 2022 (from 2024), and consider additional site locations;  Accommodate new regional programs: STEM, Language Immersion, Performing Arts;  Move the open date of Ellicott Mills MS to 2022; and  Replace the Applications and Research Lab with a MS/HS Career Development Center. Goals of the Attendance Area Adjustment process and the Capital Budget development process include reducing the number of schools outside of the target utilization range, while moving forward with the Interim Superintendent’s mission to ensure equitable outcomes and support student success. The recommended budget, in conjunction with a boundary adjustment plan, proposes to reduce the number of schools outside of the target utilization range while minimizing the number of students effected by a change in school assignments. Stakeholder feedback helped develop this budget The $79.7 million Capital Budget, $616 million Capital Improvement Program and $1.3 billion Long-Range Master Plan for FY 2019-2028 support the Interim Superintendent’s goal to build an inclusive, nurturing environment, close opportunity gaps, and address projected student enrollment and existing facility needs. The Capital Improvement Program and Long-Range Master Plan address existing and projected facility needs to support our projected growth of 9,800 additional students between 2018 and 2028. In addition to the changes noted above, the FY 2019 Superintendent’s Proposed Capital Budget includes the completion of New Elementary School #42, scheduled for opening in August 2018 and an addition to Waverly Elementary School to increase school capacity. An addition was added to the Hammond HS renovation project scope, funding for four future elementary schools and a future high school, as well as systemic renovations and major programmatic renovations. The Superintendent’s FY 2019 Capital Budget was finalized and presented to the Board after the AAC had completed their recommendation. The Interim Superintendent asked the AAC to develop an alternative plan to address his recommendation that the opening of New HS #13 open

10

slide-14
SLIDE 14

in 2022, potentially in another location, as noted in section IV, 2017 Attendance Area Committee (AAC) Process.

  • VIII. Public Participation and Input

Community input remains an important part of the attendance area adjustment process. Changes were made to help improve public input this year through electronic correspondence, live- streaming AAC meetings and by adjusting the regional meeting format to allow interactive

  • discussion. Staff is committed to study further improvements.

For a number of years, staff has considered the number of email messages received as a positive indication of outreach. However, as the volume of correspondence has rapidly increased, we are unable to process the key points raised by the community in a timely manner. Online surveys have been used to collect the majority of feedback for the AAC and HCPSS staff. It is much easier to collect, but more importantly, has enabled us to keep up with the comments and easily remove identifying information and share them with the committee and the community via our website. Our regional meeting format changed to reflect our success with the Spring public input forums. The Spring forums included a short presentation, and then offered residents the opportunity to speak in small groups with HCPSS facilitators. The Fall regional open houses provided residents the opportunity to see details of the Feasibility Study and AAC plan, and speak directly to HCPSS School Planning, Policy and Transportation staff. The open houses were developed to provide a satisfying and meaningful opportunity for both the public and HCPSS staff. This made it easy for participants to find someone to discuss their concern or question. The facilitation format and online survey allowed better collection of input. The most recent online survey accepted feedback from September 12 through early morning September 29, and 4,226 responses were received. An initial review of the survey responses has yielded the below draft assessments of residents’ feedback on the AAC 8/22 plan, AAC Alternative plan and the Feasibility Study.

11

slide-15
SLIDE 15

Respondent-Reported Schools Total responses: 4,226 Respondents were required to select one elementary, one middle, and one high school. For elementary and middle schools, only those identified in at least 2% of the responses are

  • displayed. All survey results were recorded and included in data displayed below. Respondents

were able to complete the survey multiple times. Reason for Completing Survey Respondents were able to complete the survey multiple times. Comments on the 8/22 Attendance Area Committee Plan, the Attendance Area Committee Alternative Plan, and the Feasibility Study Plan are summarized below. The top responses listed include only actionable choices related to Policy 6010 School Attendance Areas standards.

1% 1% 3% 3% 5% 7% 7% 8% 9% 11% 12% 31% Reservoir Hammond Long Reach Oakland Mills Glenelg

  • Mt. Hebron

Marriotts Ridge Atholton Wilde Lake River Hill Howard Centennial 2% 2% 2% 2% 3% 3% 3% 4% 4% 4% 4% 4% 6% 6% 6% 8% 13% 16% Veterans West Friendship Clemens Crossing Ilchester Atholton Waverly Bushy Park Clarksville Gorman Crossing Rockburn Triadelphia Ridge

  • St. John's Lane

Elkridge Manor Woods Thunder Hill Pointers Run Centennial Lane Northfield 2% 2% 3% 3% 3% 3% 4% 4% 5% 7% 7% 9% 10% 15% 20% Hammond Lime Kiln Oakland Mills Glenwood Bonnie Branch Ellicott Mills Harper's Choice Murray Hill Folly Quarter Patapsco Mount View Elkridge Landing Clarksville Burleigh Manor Dunloggin

4.5%, 192 2.7%, 113 9.3%, 395 7.1%, 302 11.9%, 503 53.2%, 2248 11.2%, 473

500 1000 1500 2000 2500

a question a question or concern about Policy 6010 an alternative scenario (plan) suggestion an alternative to redistricting (instead of boundary… comments on Attendanace Area Alternate Plan (9/26) comments on Attendanace Area Committee Plan (8/22) comments on Feasibility Study Plan Number of responses

53% of the responses were about the Attendance Area Committee Plan.

Total responses: 4226 Reason for completing survey:

12

slide-16
SLIDE 16

Comments on the 8/22 Attendance Area Committee Plan Comments on the 9/27 Attendance Area Committee Alternate Plan

Excellent/Good 522 23% Neutral 62 3% Fair/Poor 1664 74% Excellent/Good 90 18% Neutral 12 2% Fair/Poor 400 80%

2,248 responses were on the Attendance Area Committee Plan. The top reasons cited for rating the AAC 8/22 plan as fair or poor were were in regards to maintaining contiguous communities or neighborhoods, transportation considerations, and keeping student feeds together. The top reasons cited for rating the AAC 8/22 plan as good or excellent were in regards to maintaining contiguous communities or neighborhoods and keeping student feeds together. 502 responses were on the Attendance Area Alternate Plan. The top reasons cited for rating the AAC Alternative Plan as fair or poor were in regards to maintaining contiguous communities or neighborhoods, transportation considerations, and keeping student feeds together. The top reasons cited for rating the AAC Alternative Plan as good or excellent were in regards to keeping student feeds together and maintaining contiguous communities or neighborhoods.

13

slide-17
SLIDE 17

Comments on the Feasibility Study Plan Summary of Feedback

  • At least three-quarters of all responses rated the Attendance Area Committee Plan as well

as the Attendance Area Alternate Plan as poor or fair.

  • 54% of all responses rated the Feasibility Study Plan as poor or fair and almost 40% rated

it as good or excellent.

  • Across the three plans, respondents regarded maintaining contiguous communities or

neighborhoods and keeping student feeds together as the top considerations in their rating

  • f the plan.
  • Transportation considerations were among the top three considerations.

IX. Superintendent Recommended Attendance Area Adjustments

The Superintendent’s recommendation includes elementary school level boundary changes with minor adjustments at the middle school level. The middle school adjustments support middle school from the elementary school feeds. High school redistricting is not proposed for the 2018- 2019 school year. The proposed plan addresses the following:  Open of New Elementary School #42;  Balancing capacity utilization of Manor Woods Elementary School (using the Waverly Elementary School addition and western capacity);  Balancing capacity utilization of Columbia West planning region (using the Swansfield Elementary School addition and western capacity)  Minimal middle school level student movement to align feeds to the middle schools affected by moves proposed at the elementary school level.  No high school boundary adjustments are proposed for the 2018-2019 school year. Program additions/changes at Oakland Mills HS and River Hill HS are proposed. Several of the elementary school moves proposed with this recommendation are inclusive of AAC recommendations of August 22, 2017.

Excellent/Good 186 39% Neutral 32 7% Fair/Poor 255 54%

473 responses were on the Feasibility Study Plan. The top reasons cited for rating the Feasibility Study Plan as fair or poor were in regards to maintaining contiguous communities or neighborhoods and keeping student feeds together. The top reason cited for rating the Feasibility Study Plan as good or excellent was in regards to maintaining contiguous communities or neighborhoods.

14

slide-18
SLIDE 18

Programmatic changes are proposed at the high school level to balance utilization; therefore, the Superintendent’s recommended plan does not include any specific changes in high school attendance area boundaries. Specific boundary changes and effects are noted in the next

  • sections. The next high school attendance area adjustment process will begin during the 2020-

2021 school year to allow time to prepare for opening New HS #13 in Fall of 2022.

X. Specific Geographic Recommendations for August 2018

Table 1. 2018 Elementary Recommendation Sending Receiving Polygons # Students Bellows Spring ES Rockburn ES 83, 1083 72 Bellows Spring ES Waterloo ES 1076 71 Bryant Woods ES Longfellow ES 268, 1268, 2268 158 Bushy Park ES Lisbon ES 234, 280, 282 44 Clemens Crossing ES Pointers Run ES 127, 130, 1130 192 Deep Run ES Bellows Spring ES 79, 1079 57 Deep Run ES New ES #42 30, 1030, 2030 100 Ducketts Lane ES New ES #42 33, 35, 1035, 1036, 2035, 4035 418 Manor Woods ES Bushy Park ES 304, 305, 1304, 1305 145 Manor Woods ES Triadelphia Ridge ES 178, 179, 1178, 1179 71 Manor Woods ES Waverly ES 164, 1164 44 Pointers Run ES Clarksville ES 129, 1064, 1129 91 Pointers Run ES Dayton Oaks ES 189, 1192 29 Rockburn ES Deep Run ES 32 87 Rockburn ES New ES #42 1032 106 Running Brook ES Bryant Woods ES 204, 1204, 2133, 3133 71 Running Brook ES Clemens Crossing ES 2136 14 St Johns Lane ES Waverly ES 161, 1161 120 Waverly ES West Friendship ES 166, 1166, 2166 32 TOTAL 1,922

15

slide-19
SLIDE 19

Table 1. 2018 Middle Recommendation Sending Receiving Polygons # Students Burleigh Manor MS Mount View MS 164, 1164 29 Clarksville MS Lime Kiln MS 189 1 Folly Quarter MS Clarksville MS 1176 Harpers Choice MS Wilde Lake MS 66, 134, 1066, 1134, 2134 47 Lime Kiln MS Clarksville MS 118, 120, 123, 126, 127, 296, 1120, 1123, 1296 129 Mayfield Woods MS Elkridge Landing MS 83, 1083 33 Mount View MS Folly Quarter MS 178, 179, 1178, 1179 44 Wilde Lake MS Clarksville MS 130, 1130 30 TOTAL 313

16

REVISED

slide-20
SLIDE 20

Atholton ES 107% Bellows Spring ES 87% Bollman Bridge ES 106% Bryant Woods ES 91% Bushy Park ES 85% Centennial Lane ES 114% Clarksville ES 91% Clemens Crossing ES 76% Cradlerock ES 102% Dayton Oaks ES 81% Deep Run ES 93% Ducketts Lane ES 79% Elkridge ES 109% Forest Ridge ES 98% Fulton ES 111% Gorman Crossing ES 102% Guilford ES 93% Hammond ES 98% Hollifield Station ES 108% Ilchester ES 86% Jeffers Hill ES 104% Laurel Woods ES 82% Lisbon ES 93% Longfellow ES 111% Manor Woods ES 88% New ES #42 75% Northfield ES 106% Phelps Luck ES 94% Pointers Run ES 104% Rockburn ES 86% Running Brook ES 91% St Johns Lane ES 97% Stevens Forest ES 100% Swansfield ES 102% Talbott Springs ES 118% Thunder Hill ES 107% Triadelphia Ridge ES 109% Veterans ES 111% Waterloo ES 95% Waverly ES 107% West Friendship ES 88% Worthington ES 90%

O

Superintendent's Proposed Redistricting - ES Projected 2018 Utilization

Date: 10/2/2017

17

slide-21
SLIDE 21

XI. Maps

On the following pages, the proposed plans for the current year attendance area adjustment recommendations are mapped. It should be noted that none of these maps represent approved

  • plans. Redistricting approved by the Board of Education in November 2017 would take effect in

August 2018. Plans for future years would also require Board of Education approval in the fall

  • f the year before they are to take effect.

18

slide-22
SLIDE 22

¹ º ¹ º ¹ º ¹ º ¹ º ¹ º ¹ º ¹ º ¹ º ¹ º ¹ º ¹ º ¹ º ¹ º ¹ º ¹ º ¹ º ¹ º ¹ º ¹ º ¹ º ¹ º ¹ º ¹ º ¹ º ¹ º ¹ º ¹ º ¹ º ¹ º ¹ º ¹ º ¹ º ¹ º ¹ º ¹ º ¹ º ¹ º ¹ º ¹ º ¹ º

£ ¤

29

§ ¨ ¦

895

§ ¨ ¦

70

§ ¨ ¦

95

§ ¨ ¦

70

2137 164 1176 217 3023 2071 2146 3147 44 2035 1035 259 1155 2099 1310 96 261 1136 1018 18 1256 2133 1194 194 190 2062 155 1096 62 1261 1045 45 256 1125 125 3133 1204 204 1190 1187 187 91 279 1272 272 269 1263 2263 263 2023 1012 12 1064 64 52

48

46 1043

41

1004 4 1039 39 1299 299 1297

297

275 1019 19 1180 180 1164 1157 157 1015 15 1129 129

120

1108 108 101 81 78 74 311 271 1269 172 126 1100 100 1094 94 1090 90 1008 8 1066

66

1054 1305 305 1304 304 1301 301 1296 296 1265 265 1235 235 221 1200 200 198 1195 195 1193 193 1178 178 1177 177 2176 1171 171 1168 168 1144 144 1141 141 1140 140 137

134

1130 130 1119 119 114 1112 10 1009 9 86 1086 1079 79 77 1076 76 1075 75 1073 73

1006

6 1005 1033 33 1308 1300 300 1298 298 1266 266 1260 260 1025 25 1002 1016 16 1148 1146 1014 14 13 1121 121 1116 116 107 1106 106 1105 105 1001 1 1089 1040 38 1036 36 1032 32 1309 309 30 1003 3 1027 27 2268

1026

23

2022

20 1188 188 173 1017 17 1163 1156 1154 2154 154 145 1142

142 1128

128 1124 124 1117 212 290 236

1236

2236 280 1280 241 282 281 239 294 248 1248 2248 3248 247 1247 250 1250 2250 3250 249 1249 240 1240 243 1243 1244 2247 3247 245 1245 2245 88 1083 83 70 7 1007 63 37 1238 1234 234 1216 216 186 1184 2184 184 183 1159 159 1153 153 1011 1093 71 1060 4047 1031 31 303 1303 28 2191 1189 1080 1056 113 1058 1143 143 2143 3143 1095 223 1152 152 1151 1103 103 225 274

307

229 1229 2229 228 2228 224 1224 1166 29

1029

165 1165

160 1160 162 306 1306 2306 166 2166 203 232 211 209 291 215 1215 205 1205 2205 201 1201 202 1202 1196 196 199 1199 206 1206 207 1207 210 1210 2210 220 218 1218

293

1293 233 1233 2233 231 1231 1259 2107 3107 150 4150 3150 1150 2150 147

5147

131 1028 2028 93 1091 3091 1077 2077 2087 1081 2081 95 2095 2068 5

2005

47 3047 1046 2046 3046 2012 3012 1186 1030 2030 3035 35 4035 2041 92 4041 42 3042 43 2043

1037

2037

2082

82 2 2002 21 24 267 1047 2047 1038 2038 40 2040

1042

2042 4042 5041 1041 84 87 3087 1087 4087 89 85 2085 3085 3075 2075 98 1098 3071 1071 60 2060 55 2054 54 58 2058 2139 139 1139 3139 2050 50 2048 57 2057 2056 11 2011 273 1010 2010 1227 1221

2221

2059 1059 59 3059 2113 3113 1113 4113

2641070

2070 1069 3069 506969 3068 68 67 1067 151 2151

276

148 2148 1111 111 2111 2093 3093 4093 2310 310 2101 1101 3101 1102 102 3191 1191 104 1104 2308 191 308 1107 72 262 109 1109 1162 2161 1161 161

158

3034 97 1034 2034 149 219 302 146 3146 1145 2145 4133 5133

1133

2136 268 1268 1137 3137 61 1131

2131

4131 2132 1132 132 127 122 1114 2112 112 2115 115 118 1192 2189 1135 2053 1174 174 2138 1138 138 3138

175

1175 2175 156 2156 214 179 1179 1170 167 4169 2169 3169 163 2226 226 3226 1226 1228 3228 2223 222 2182 3182 1181 181 3176 176 1183 185 1185

197

2198 1198 2238 2220 1220 3056 56 270 1115 3115 1020 1048 3048 2147 4147 1147 3238 238 1182 182 22 1022 1223 3223 2170 170 1208 208 99 295 169 5169 6169 2163 1169 7169 3136 4136 136 2063 1063 2204 189 244 213 26 1082 1057 1023 80 2215 34 2114 1222 2183

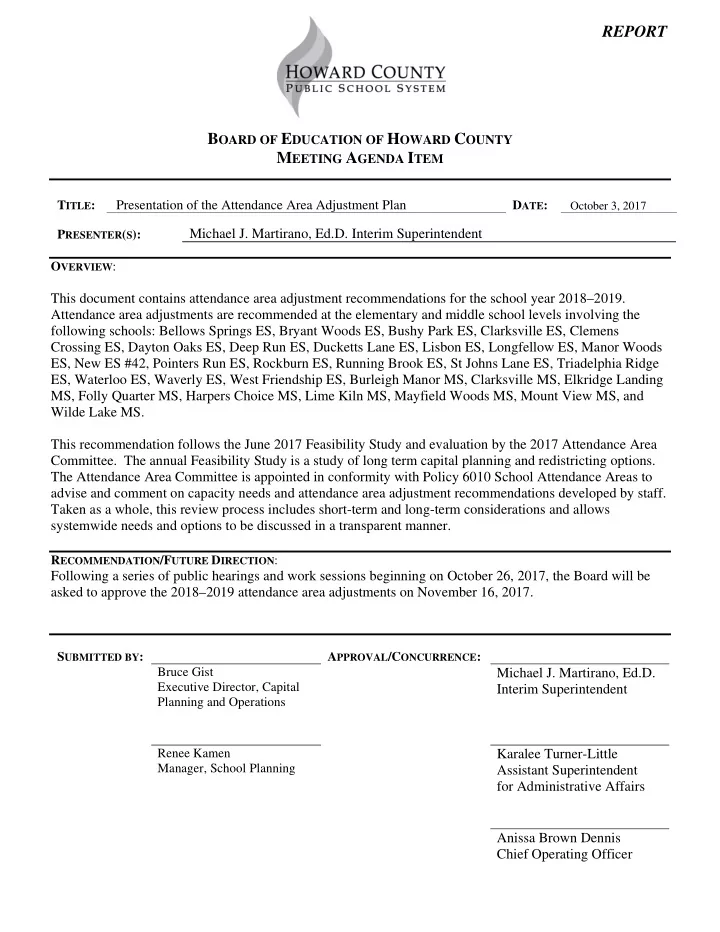
From: Deep Run ES To: Bellows Spring ES From: Running Brook ES To: Bryant Woods ES From: Manor Woods ES To: Bushy Park ES From: Pointers Run ES To: Clarksville ES From: Running Brook ES To: Clemens Crossing ES From: Pointers Run ES To: Dayton Oaks ES From: Rockburn ES To: Deep Run ES From: Bushy Park ES To: Lisbon ES From: Bryant Woods ES To: Longfellow ES From: Deep Run ES To: New ES #42 From: Ducketts Lane ES To: New ES #42 From: Rockburn ES To: New ES #42 From: Clemens Crossing ES To: Pointers Run ES From: Bellows Spring ES To: Rockburn ES From: Manor Woods ES To: Triadelphia Ridge ES From: Bellows Spring ES To: Waterloo ES From: Manor Woods ES To: Waverly ES From: St Johns Lane ES To: Waverly ES From: Waverly ES To: West Friendship ES

Dayton Oaks ES Deep Run ES Elkridge ES Ilchester ES Rockburn ES Waterloo ES Bellows Spring ES Worthington ES Atholton ES Bollman Bridge ES Forest Ridge ES Gorman Crossing ES Hammond ES Laurel Woods ES Centennial Lane ES Hollifield Station ES Manor Woods ES Northfield ES St Johns Lane ES Waverly ES West Friendship ES Bushy Park ES Clarksville ES Fulton ES Pointers Run ES Triadelphia Ridge ES Cradlerock ES Jeffers Hill ES Phelps Luck ES Stevens Forest ES Talbott Springs ES Thunder Hill ES Bryant Woods ES Longfellow ES Running Brook ES Swansfield ES Guilford ES Lisbon ES Clemens Crossing ES Veterans ES Ducketts Lane ES

U V

32

U V

99

U V

32

U V

97

U V

175

U V

100

U V

108

U V

216

Date: 10/2/2017

Redistricting Proposed in These Areas

Superintendent's Proposed Redistricting - ES School Year 2018-19

19

slide-23
SLIDE 23

¹ º ¹ º ¹ º ¹ º ¹ º ¹ º ¹ º ¹ º ¹ º ¹ º ¹ º ¹ º ¹ º ¹ º

§ ¨ ¦

895

§ ¨ ¦

95

277

3023 2071 44 2035 1035 96 261 1018 1018 18 2062 1062 62 1261 1045 45 279 1272 272 269 2023 52 48 46 1043 41 1004 4 1039 39 1299 299 81 78 65 1050 49 1269

1265

86 1086 1079 79 77 1076 76 1075 75 1073 73 1006 6 1033 33 1300 300 1298 298 1266 266 260 1025 25 121 1040 38 1036 36 1032 32 30 1027 27 1026 23 2022 20 1124 124 1083 83 70 63 37 71 1060 4047 1080 113 1058 1095 1051 2051 51 1091 1077 2077 2087 1081 2081 95 1068 2068 47 3047 1046 2046 3046 3012 1030 2030 3035 35 4035 2041 3041 92 4041 42 3042 43 2043 1037 2037 2082 82 21 24 267 1047 2047 1038 2038 40 2040 1042 2042 4042 5041 1041 84 87 3087 1087 4087 2088 1088 85 2085 3085 1085 3075 2075 1074 3071 1071 60 2060 55 2054 54 58 2058 2139 2139 139 1139 3139 2050 50 2048 2059 1059 59 3059 2113 3113 1113 4113 264 1070 2070 2069 1069 4069 3069 5069 69 3068 68 151 2151 1065 1020 1048 3048 22 1022 2063 1063 26 1082 1023 80

From: Deep Run ES To: Bellows Spring ES From: Rockburn ES To: Deep Run ES From: Deep Run ES To: New ES #42 From: Ducketts Lane ES To: New ES #42 From: Rockburn ES To: New ES #42 From: Bellows Spring ES To: Rockburn ES From: Bellows Spring ES To: Waterloo ES

Deep Run ES Elkridge ES Rockburn ES Waterloo ES Bellows Spring ES Bollman Bridge ES Forest Ridge ES Cradlerock ES Jeffers Hill ES Phelps Luck ES Stevens Forest ES Talbott Springs ES Guilford ES Ducketts Lane ES

U V

32

U V

175

U V

100

Date: 10/2/2017

Redistricting Proposed in These Areas

Superintendent's Proposed Redistricting - ES School Year 2018-19

20

slide-24
SLIDE 24

¹ º ¹ º ¹ º ¹ º ¹ º ¹ º ¹ º ¹ º

£ ¤

29

2137 1176 2146 96 1136 2133 190 1096 1125 125 125 3133 1204 204 1190 1187 187 1064 64 1015 15 1129 129 1120 120 1172 172 126 1066 66 1054 1296 296 235 1200 200 1193 193 1177 177 1144 144 1141 141 1140 140 137 134 1130 130 1119 119 114 1016 16 1014 14 13 2268 1188 188 1017 17 145 1142 142 1128 128 1117 117 186 1011 28 1189 1056 1143 143 2143 3143 201 1202 131 1028 2028 1186 54 2139 2139 2048 57 2057 2056 1110 1113 4113 146 1145 2145 4133 5133 1133 2136 268 1268 1137 3137 1134 2134 61 1131 3131 2131 4131 2132 1132 132 127 122 1114 118 1192 2189 1123 123 135 1053 1135 53 2053 2135 2174 1174 174 3174 2138 1138 138 3138 175 3176 176 185 1185 197 2198 1198 3056 56 270 1115 3115 295 3136 4136 136 133 2204 189 1057

From: Running Brook ES To: Bryant Woods ES From: Pointers Run ES To: Clarksville ES From: Running Brook ES To: Clemens Crossing ES From: Pointers Run ES To: Dayton Oaks ES From: Bryant Woods ES To: Longfellow ES From: Clemens Crossing ES To: Pointers Run ES

Atholton ES Clarksville ES Pointers Run ES Bryant Woods ES Longfellow ES Running Brook ES Swansfield ES Clemens Crossing ES

U V

32

U V

216

U V

108

U V

175

Date: 10/2/2017

Redistricting Proposed in These Areas

Superintendent's Proposed Redistricting - ES School Year 2018-19

21

slide-25
SLIDE 25

¹ º ¹ º ¹ º ¹ º ¹ º ¹ º ¹ º ¹ º ¹ º ¹ º ¹ º ¹ º ¹ º ¹ º

£ ¤

29

§ ¨ ¦

70 2137 164 2146 3147 1155 1136 155 1019 19 1180 180 1164 1157 157 65 311 271 1172 172 1100 1305 305 1304 304 1200 200 1178 178 1177 177 2176 1171 171 1168 168 1144 144 1141 141 1140 140 137 1148 1146 107 1106 2268 173 1163 1156 1154 2154 154 145 1142 142 212 290 236 1236 2236 280 1280 241 241 282 281 239 294 3250 1249 1249 240 1240 243 243 1243 2245 2245 63 1238 1234 234 1216 216 1184 2184 184 183 1159 159 1153 153 1031 31 303 1303 1143 143 2143 3143 223 1152 152 1151 225 274 307 229 1229 2229 228 2228 224 1224 1166 29 1029

165

1165 160 1160 162 1306 166 2166 203 232 211 209 291 215 1215 205 1205 2205 202 1202 199 1199 206 1206 207 1207 210 1210 2210 220 218 1218 293 1293 233 1233 2233 231 1231 3107 150 4150 3150 1150 2150 147 5147 1068 2068 1186 67 1067 151 2151 1065 2065 276 148 2148 1111 111 2111 1102 191 72 262 109 1162 2161 1161 161 158 3034 97 1034 2034 149 219 302 146 3146 1145 2145 268 1268 1137 2138 138 3138 175 1175 2175 156 2156 1173 2173 214 179 1179 1170 167 4169 2169 3169 163 2226 226 3226 1226 1228 3228 2223 222 2182 3182 1181 181 3176 176 1183 185 1185 2238 2220 1220 2147 4147 1147 3238 238 1182 182 1223 3223 2170 170 1208 208 169 5169 6169 2163 1169 7169 3136 3136 136 244 244 213 2215 34 1222 2183

From: Manor Woods ES To: Bushy Park ES From: Bushy Park ES To: Lisbon ES From: Bryant Woods ES To: Longfellow ES From: Manor Woods ES To: Triadelphia Ridge ES From: Manor Woods ES To: Waverly ES From: St Johns Lane ES To: Waverly ES From: Waverly ES To: West Friendship ES

Dayton Oaks ES Centennial Lane ES Manor Woods ES Northfield ES St Johns Lane ES Waverly ES West Friendship ES Bushy Park ES Triadelphia Ridge ES Thunder Hill ES Bryant Woods ES Longfellow ES Running Brook ES Lisbon ES

U V

175

U V

99

U V

32

U V

97

U V

108

Date: 10/2/2017

Redistricting Proposed in These Areas

Superintendent's Proposed Redistricting - ES School Year 2018-19

22

slide-26
SLIDE 26

¹ º ¹ º ¹ º ¹ º ¹ º ¹ º ¹ º ¹ º ¹ º ¹ º ¹ º ¹ º ¹ º ¹ º ¹ º ¹ º ¹ º ¹ º ¹ º ¹ º

£ ¤

29

£ ¤

29

§ ¨ ¦

895

§ ¨ ¦

70

§ ¨ ¦

95

§ ¨ ¦

70

2137 164 1176 217 277 3023 2071 2146 3147 44 2035 1035 259 1155 2099 1310 96 261 1136 1018 1256 2133 1194 194 190 2062 155 1096 1062 62 1261 1045 45 256 1125 125 3133 1204 204 1190 1187 187 91 279 1272 272 269 1263 2263 263 2023 1012 12 1064 64 52

48

46 1043

41

1004 4 1039 39 1299 299 1297

297

275 1019 19 1180 180 1164 1157 157 1015 15 1129 129 1120 120 1108 108 101 81 78 74 65 1050 49 311 271 1269 1172 172 126 1100 100 1094 94 1090 90 1008 8 1066 66 1054 1305 305 1304 304 1301 301 1296 296 1265 265 1235 235 221 1200 200 198 1195 195 1193 193 1178 178 1177 177 2176 1171 171 1168 168 1144 144 1141 141 1140 140 137 134 1130 130 1119 119 114 1112 10 1009 9 86 1086 1079 79 77 1076 76 1075 75 1073 73

1006

6 1005 1033 33 1308 1300 300 1298 298

1266

266 1260 260 1025 25 1002 1016 16 1148 1146 1014 14 13 1121 121 1116 116 107 1106 106 1105 105 1001 1 1089 1040 38 1036 36 1032 32 1309 309 30 1003 3 1027 27 2268

1026

23

2022

20 1188 188 173 1017 17 1163 1156 1154 2154 154 145 1142 142 1128 128 1124 124 1117 117 212 290 236

1236

2236 280 1280 241 282 281 239 294 248 1248 2248 3248 247 1247 250 1250 2250 3250 249 1249 240 1240 243 1243 1244 2247 3247 245 1245 2245 88 1083 83 70 7 1007 63 37 1238 1234 234 1216 216 186 1184 2184 184 183 1159 159 1153 153

1011

1093 71 1060 4047 1031 31 303 1303 28 2191 1189 1080 1056 113 1058 1143 143 2143 3143 1095 1051 2051 51 223 1152 152 1151 1103 103 225 274

307

229 1229 2229 228 2228 224 1224 1166 29

1029

165 1165

160 1160 162 306 1306 2306 166 2166 203 232 211 209 291 215 1215 205 1205 2205 201 1201

202

1202 1196 196 199 1199 206 1206 207 1207 210 1210 2210 220 218 1218 293 1293 233 1233 2233 231 1231 1259 2107 3107 150 4150 3150 1150 2150 147 5147 131 1028 2028 93 1091

2091

3091 1077 2077 2087 1081 2081 95 2095 1068 2068 5 2005 47 3047 1046 2046 3046 2012 3012 1186 1030 2030 3035 35 4035 2041 92 4041 42 3042 43 2043

1037

2037

2082

82 2 2002 21 24 267 1047 2047 1038 2038 40 2040

1042 2042

4042 5041

1041

84 87 3087 1087 4087 89 2088 1088 85 2085 3085 3075 2075 1074 2074 98 1098 3071 1071 60 2060 55 2054 54 58 2058 2139 139 1139 3139 2050 50 2048 57 2057

2056

11 2011 273 1010 2010 1227 1221

2221

2059 1059 59 3059 1110 2113 3113 1113 4113

264 1070

2070 1069 4069 5069 69 3068 68 67 1067 151 2151 1065 2065

276

148 2148 1111 111 2111 2093 3093 4093 2310 310 2101 1101 3101 1102 102 3191 1191 104 1104 2308 191 308 1107 72 262 109

1109

1162 2161 1161 161

158

3034 97 1034 2034 149 219 302 146 3146 1145 2145 4133 5133 1133 2136 268 1268 1137 3137 1134 2134 61 1131 3131 2131 4131 2132 1132 132 127 122 1114 2112 112 2115 115 118 1192 2189 1123 123 135 1053 1135 53 2053 2135 2174 1174 174 3174 2138 1138 138 3138 175 1175 2175 156 2156 1173 2173 214 179 1179 1170 167 4169 2169 3169 163 2226 226 3226 1226 1228 3228 2223 222 2182 3182 1181 181 3176 176 1183 185 1185 2198 1198 2238 2220 1220 3056

56

270 1115 3115 1020 1048 3048 2147 4147 1147 3238 238 1182 182 22 1022 1223 3223 2170 170 1208 208 99 295 169 5169 6169 2163 1169 7169 3136 4136 136 2063 1063 133 2204 189 244 213 26 1082

1057

1023 80 2215 34 2114 1222 2183

From: Folly Quarter MS To: Clarksville MS From: Lime Kiln MS To: Clarksville MS From: Wilde Lake MS To: Clarksville MS From: Mayfield Woods MS To: Elkridge Landing MS From: Mount View MS To: Folly Quarter MS From: Clarksville MS To: Lime Kiln MS From: Burleigh Manor MS To: Mount View MS From: Harpers Choice MS To: Wilde Lake MS

Bonnie Branch MS Burleigh Manor MS Clarksville MS Dunloggin MS Elkridge Landing MS Ellicott Mills MS Glenwood MS Hammond MS Harpers Choice MS Lime Kiln MS Mayfield Woods MS Mount View MS Murray Hill MS Oakland Mills MS Lake Elkhorn MS Patapsco MS Patuxent Valley MS Wilde Lake MS Folly Quarter MS Thomas Viaduct MS

U V

32

U V

99

U V

32

U V

97

U V

175

U V

100

U V

108

U V

216

Date: 10/3/2017

Areas Proposed to be Reassigned

Superintendent's Proposed Redistricting - MS School Year 2018-19

23

slide-27
SLIDE 27

¹ º ¹ º ¹ º ¹ º ¹ º ¹ º ¹ º ¹ º ¹ º ¹ º ¹ º

£ ¤

29

§ ¨ ¦

895

§ ¨ ¦

95 2137 217 277 3023 2071 2146 44 2035 1035 1155 2099 1310 96 261 1136 1018 18 2133 2062 155 1096 1062 62 1261 1045 45 3133 1204 204 91 279 1272 272 269 2023 52 48 1043 41 1004 4 1039 39 1299 299 275 1019 19 1157 157 1015 15 101 81 78 74 65 1050 49 311 271 1269 1100 100 1094 94 1090 90 1054 1301 301 1265 265 1144 144 137 86 1086 1079 79 77 1076 76 1075 75 1073 73 1006 6 1005 1033 33 1300 300 1298 298 1266 266 1025 1025 1025 25 1016 16 1148 1146 1014 14 13 1105 1089 1040 38 1036 36 1032 32 1309 309 30 1027 27 2268 2268 1026 23 2022 20 173 1017 17 1156 1154 2154 154 145 1124 124 88 1083 83 70 7 1007 63 37 1184 2184 184 1153 153 1093 71 1060 4047 2191 1080 1056 113 1058 1095 1051 2051 51 1152 152 1151 1103 103 150 4150 3150 1150 2150 147 5147 131 93 1091 2091 3091 1077 2077 2087 1081 2081 95 2095 1068 2068 5 2005 3047 1030 2030 3035 35 4035

2041 3041 92 4041 42 3042 43 2043 1037 2037 2082 82 21 24 1047 2047 1038 2038 40 2040 1042 2042 4042 5041 1041 84 87 3087 1087 4087 89 2088 1088 85 2085 3085 1085 3075 2075 1074 2074 98 1098 3071 1071 60 2060 55 2054 54 58 2058 2139 139 1139 3139 2050 50 2048 57 2057 2056 11 2011 273 1010 2010 2059 1059 59 3059 1110 2113 3113 1113 4113 264 1070 2070 2069 1069 4069 3069 5069 69 3068 68 67 1067 151 2151 1065 2065 276 148 2148 1111 111 2111 2093 3093 4093 2310 310 2101 1101 3101 1102 102 3191 1191 104 1104 191 149 219 302 146 3146 1145 2145 2136 1137 3137 2131 4131 1132 132 156 2156 1173 1173 2173 214 3056 56 1020 1048 3048 2147 1147 22 1022 99 3136 4136 136 2063 1063 26 1082 1057 1057 1023 80

From: Mayfield Woods MS To: Elkridge Landing MS

Bonnie Branch MS Burleigh Manor MS Dunloggin MS Elkridge Landing MS Ellicott Mills MS Mayfield Woods MS Murray Hill MS Oakland Mills MS Lake Elkhorn MS Patuxent Valley MS Thomas Viaduct MS

U V

108

U V

175

U V

100

U V

32

U V

216

Date: 10/3/2017

Areas Proposed to be Reassigned

Superintendent's Proposed Redistricting - MS School Year 2018-19

24

slide-28
SLIDE 28

¹ º ¹ º ¹ º ¹ º ¹ º ¹ º ¹ º

£ ¤

29

§ ¨ ¦

70

164 2146 3147 1155 155 275 1019 19 1180 180 1164 1157 157 108 311 271 1100 100 1305 305 1304 304 1200 200 1178 178 1177 177 2176 1171 171 1168 168 1144 144 1141 141 1148 1146 107 1106 106 173 1163 1156 1154 2154 154 145 1142 142 63 1216 1184 2184 184 183 1159 159 1153 153 1031 31 303 1303 1143 143 2143 3143 223 1152 152 1151 1103 103 225 274 307 1229 2229 2228 224 1224 1166 29 1029 165 1165 160 1160 162 1306 1306 166 2166 203 232 209 291 205 202 202 1199 206 207 1207 2210 220 218 1218 293 1233 231 231 1231 2107 3107 150 4150 3150 1150 2150 147 5147 1068 1074 2074 98 1098 68 67 1067 151 151 151 1065 2065 276 148 2148 1111 111 2111 1101 1101 3101 1102 102 102 3191 1191 191 308 1107 72 262 109

1109

1162 2161 1161 161 158 3034 97 1034 2034 149 219 302 146 3146 1145 2145 1268 1137 175 1175 2175 156 2156 1173 2173 214 179 1179 1170 167 4169 2169 3169 163 2226 226 3226 3226 1226 1228 3228 2223 222 2182 3182 1181 181 3176 176 1183 185 1185 2220 1220 2147 4147 1147 1182 182 1223 3223 2170 170 1208 208 169 5169 6169 2163 1169 7169 34 1222 2183

From: Mount View MS To: Folly Quarter MS From: Burleigh Manor MS To: Mount View MS

Burleigh Manor MS Dunloggin MS Ellicott Mills MS Mount View MS Patapsco MS Folly Quarter MS

U V

99

U V

100

U V

32

U V

175

U V

108

Date: 10/3/2017

Areas Proposed to be Reassigned

Superintendent's Proposed Redistricting - MS School Year 2018-19

25

slide-29
SLIDE 29

¹ º ¹ º ¹ º ¹ º ¹ º ¹ º ¹ º ¹ º

£ ¤

29

§ ¨ ¦

95

2137 1176 2146 259 96 1136 1018 18 1256 2133 1194 194 190 2062 1096 1062 62 256 1125 125 3133 1204 204 1190 1187 187 1272 1263 2263 2263 263 1064 64 52 1004 1015 15 1129 129 1120 120 1172 172 126 1008 8 1066 66 1054 1296 296 1235 235 221 1200 1200 200 198 1195 195 1193 193 177 1144 144 141 1140 140 137 134 1130 130 1119 119 114 1112 10 1009 9 1006 6 1005 1016 16 1014 14 13 2268

2022

20 1188 188 1017 17 1142 142 1128 128 1117 117 7 7 1007 63 186 1011 28 1189 1056 113 1058 143 2143 3143 2051 2051 1151 203 205 201 1201 202 1202 1196 1196 196 199 1199 1259 131 1028 2028 5 2005 1186 1047 2047 2054 54 58 2058 2139 139 1139 3139 2050 2048 57 2057 2056 11 2011 273 1010 2010 1227 1221 2221 2059 1059 1110 2113 3113 1113 4113 151

146

1145 2145 4133 5133 1133 2136 268 1268 1137 3137 1134 2134 61 1131 3131 2131 4131 2132 1132 132 127 122 1114 2112 112 2115 115 118 1192 2189 1123 123 135 1053 1135 53 2053 2135 2174 1174 174 3174 2138 1138 138 3138 3176 185 1185 197 2198 1198 3056 56 270 1115 3115 1020 22 295 3136 4136 136 2063 1063 133 2204 189 1057 2114

From: Folly Quarter MS To: Clarksville MS From: Lime Kiln MS To: Clarksville MS From: Wilde Lake MS To: Clarksville MS From: Clarksville MS To: Lime Kiln MS From: Harpers Choice MS To: Wilde Lake MS

Clarksville MS Hammond MS Harpers Choice MS Lime Kiln MS Murray Hill MS Oakland Mills MS Lake Elkhorn MS Wilde Lake MS

U V

175

U V

216

U V

32

U V

108

Date: 10/3/2017

Areas Proposed to be Reassigned

Superintendent's Proposed Redistricting - MS School Year 2018-19

26

slide-30
SLIDE 30
  • XII. Evaluation of Attendance Area Adjustment Recommendations

This section evaluates the proposed plan using the considerations in Policy 6010 School Attendance Areas. This narrative lays plain the staff perspective and allows discussion by the Board of Education and possible alternative direction. Policy 6010 explains that the Board of Education “establishes school attendance areas in order to provide quality, equitable educational

  • pportunities to all students and to balance capacity utilization of all schools.” Consideration of

attendance area adjustments is prompted by a number of circumstances, including the opening of a new school and schools that are outside the target utilization range of 90–110 percent. Both of these conditions exist. Once the review is prompted, the policy lists factors, which will be

  • considered. The efficient use of available space is evaluated first because it is also one of the

prompts to the policy. Policy 6010 considerations are not prioritized and therefore, not weighted

  • ne over another when evaluating the potential effects a certain plan may have on those criteria.

For the Superintendent’s Plan, the following occurred: the average number of years between 90 percent and 110 percent increased by 1 ½ years; an additional non-contiguous community was created with the Turf Valley area; and the proximity to schools increased. Given the scope of attendance area adjustments proposed by this plan, the average proximity to schools is slightly higher since this plan uses available Western Region capacity to relieve

  • vercrowding at the elementary level. Rating of the transportation impacts of this plan are based
  • n a preliminary analysis. These ratings are based on predicted changes in mileage and

equipment according to the proposed attendance areas. For this preliminary review, it can be assumed changes in mileage lead to corresponding changes in distance traveled and students’ seat time. A more detailed analysis including trip tiering may lead to changes in predicted

  • impacts. School bell time changes will alter the transportation impacts of any proposed

attendance area adjustment plan.

27

slide-31
SLIDE 31
  • !

"#

  • $%

&

  • '"

&

  • &&

($

  • !

)$

  • *

+,,

  • !!
  • %.$,

* & / !

  • !
  • &

"+ *

  • 0,$1 ,2%

!!

  • 32$,
  • *

( ( ! * +" !& !! +,,

  • &

%'

  • ( (
  • +"
  • &&*

%' !&

  • 32$,

!

  • !"

! ($ *

  • %.$,

!!

  • $ ,2/

*&

  • !#

* )$ &

  • +,,
  • !

0,4 &

  • $%!"

* "+ !

  • 5
  • "&

*! ! ! "#

  • $%
  • 0,$1 ,2%

&

  • &
  • !*
  • %.$,

*

  • "#

!

  • '%
  • )$
  • &&

4

  • '"

&

  • 6*6&

07075893:7;+)&<7-&=)(-

28

10/3/17 Superintendent Proposed

slide-32
SLIDE 32
  • !"

#$%&' ()"

  • *'+&
  • )

, ))

  • ("
  • %

(

  • ,

! " .

  • )
  • '/

!

  • #*&

(

  • !

. (

  • %

!) !! 0&

  • ")

1 )

  • ()

'2 ( ! *'+&

  • !!

( 0&

  • !()

1 !" " , "( ! ,2 !( "

  • #$%!

! 3&#' " " 45' !" ( 0$*2

  • &
  • '(

!! 3&#' ( !" %+

  • )**
  • 6

!( )) 7& ) ) & )) !

  • )+

!! %28 (! ) 8

  • !!
  • '

() ! & !")

  • !!

(! 0+$2 )

  • *,
  • 45'

)" ! 7& ((

  • #*&

( "

  • $-.

" 38$2 )) ! 4$*& (

  • )"9!9!)

#:#:-5;.0<)!:*4!)=:7>-!437 29

10/3/17 Superintendent

slide-33
SLIDE 33
  • ,

!"

  • !/(
  • 3&#'
  • ,

! (( ,/ (( !! ,7$ !

  • $)

!

  • 2

("(

  • %&,

) "

  • 6
  • (

/7 ()" ( 0+$2 ( ) 0&

  • &&"
  • 1!+

!(

  • ()

!! %

  • ,/

"

  • 1!2!/$

!" 332 (

  • 7*2

( &

  • 3*/!

) 38$2 !(

  • 4$*&

( !" 4&'% !

  • &
  • !

.8?(! ( &

  • .
  • 3,

!"!

  • -2

!"

  • %28

!) ! *&23' ) "

  • )"9!9!)

#:#:-5;.0<)!:*4!)=:7>-!437

30

10/3/17 Superintendent Proposed

slide-34
SLIDE 34

2017 Superintendent Recommendation for SY 2018‐19 Attendance Area Adjustments

Elementary School Base Proposed Base Proposed Base Proposed Base Proposed Base Proposed Atholton ES 9% 10% 19% 18% 10% 9% 9% 11% 53% 53% Bellows Spring ES 24% 23% 23% 23% 11% 10% 6% 6% 35% 37% Bollman Bridge ES 10% 10% 36% 37% 19% 18% 7% 8% 28% 27% Bryant Woods ES <5% 7% 54% 49% 11% 14% 10% 11% 21% 18% Bushy Park ES 13% 21% 7% 7% <5% <5% <5% <5% 71% 63% Centennial Lane ES 46% 47% 6% <5% <5% <5% 8% 8% 36% 37% Clarksville ES 52% 47% 6% 6% <5% <5% <5% <5% 35% 40% Clemens Crossing ES 16% 10% 12% 15% 10% 12% 10% 12% 51% 51% Cradlerock ES 7% 7% 45% 49% 15% 15% 10% 10% 22% 19% Dayton Oaks ES 23% 24% 8% 8% <5% <5% <5% <5% 60% 58% Deep Run ES 16% 20% 13% 17% 38% 35% 6% 5% 26% 23% Ducketts Lane ES 18% 15% 37% 35% 18% 20% <5% <5% 23% 24% Elkridge ES 14% 14% 24% 24% 8% 8% 7% 7% 47% 47% Forest Ridge ES 25% 25% 33% 34% 12% 13% 7% 7% 21% 21% Fulton ES 30% 31% 12% 12% <5% <5% 8% 8% 46% 45% Gorman Crossing ES 25% 24% 33% 35% 14% 14% 6% 5% 22% 21% Guilford ES 12% 11% 47% 49% 11% 11% 8% 9% 22% 20% Hammond ES 14% 14% 29% 30% 11% 10% 7% 8% 38% 38% Hollifield Station ES 43% 42% 12% 12% 13% 13% <5% <5% 28% 30% Ilchester ES 26% 25% 8% 8% <5% <5% 6% 6% 57% 58% Jeffers Hill ES 15% 16% 37% 35% 15% 16% 10% 10% 22% 22% Laurel Woods ES 10% 9% 51% 51% 22% 22% 8% 7% 9% 9% Lisbon ES <5% 5% <5% <5% 9% 9% 6% 6% 77% 76% Longfellow ES 9% 7% 37% 45% 21% 18% 11% 10% 21% 18% Manor Woods ES 47% 48% 6% 6% <5% <5% <5% <5% 39% 39% New ES #42 <5% 15% <5% 41% <5% 20% <5% 6% <5% 19% Northfield ES 29% 29% 8% 9% 6% 6% 8% 7% 49% 50% Phelps Luck ES 6% 5% 40% 40% 30% 29% 8% 9% 17% 17% Pointers Run ES 32% 34% 8% 8% <5% <5% <5% <5% 52% 49% Rockburn ES 18% 18% 20% 11% 7% <5% 7% 9% 48% 57% Running Brook ES <5% <5% 51% 52% 13% 12% 10% 9% 20% 22% St Johns Lane ES 39% 40% 11% 11% <5% <5% <5% <5% 44% 44% Stevens Forest ES <5% <5% 37% 38% 32% 34% 9% 9% 17% 15% Swansfield ES 6% 6% 51% 51% 15% 15% 8% 8% 20% 20% Talbott Springs ES <5% <5% 37% 37% 24% 22% 10% 11% 25% 26% Thunder Hill ES 17% 16% 26% 26% 9% 9% 8% 9% 40% 39% Triadelphia Ridge ES 29% 28% 6% 6% 6% <5% 9% 8% 51% 53% Veterans ES 51% 50% 14% 14% 5% <5% <5% <5% 26% 27% Waterloo ES 20% 21% 30% 32% 6% 7% 7% 8% 36% 33% Waverly ES 40% 38% 6% 7% <5% <5% <5% <5% 49% 48% West Friendship ES 22% 22% <5% <5% <5% <5% 6% <5% 64% 65% Worthington ES 35% 34% 7% 8% <5% 5% <5% 5% 48% 47% Countywide Average American Indian/Alaska Native and Native Hawaiian/Other Pacific Islander are not shown as there is less than 5% population at each of the schools. "<5%" indicates a school with less than 5% population for the specified race/ethnicity. These percentages are calculated from Spring 2016 student data using geographic assignments, current and proposed attendance areas. These numbers may not exactly match other reported numbers due to differences in timing and methodology. White 22.4% 22.6% 11.2% 6.8% 36.1% Asian Black or African American Hispanic Two or more 31

slide-35
SLIDE 35

2017 Superintendent Recommendation for SY 2018‐19 Attendance Area Adjustments

Middle School Base Proposed Base Proposed Base Proposed Base Proposed Base Proposed Bonnie Branch MS 14% 14% 26% 26% 13% 13% 8% 8% 39% 39% Burleigh Manor MS 43% 43% 9% 9% <5% <5% 7% 7% 36% 36% Clarksville MS 37% 36% 6% 7% <5% 5% 5% 6% 48% 47% Dunloggin MS 34% 34% 18% 18% 8% 8% <5% <5% 38% 38% Elkridge Landing MS 13% 13% 19% 19% 6% 7% 6% 7% 54% 54% Ellicott Mills MS 31% 31% 14% 14% <5% <5% <5% <5% 45% 45% Folly Quarter MS 24% 23% 5% 5% <5% <5% 6% 6% 61% 62% Glenwood MS 7% 7% <5% <5% <5% <5% 6% 6% 77% 77% Hammond MS 11% 11% 25% 25% 10% 10% 8% 8% 46% 46% Harpers Choice MS 9% 9% 45% 46% 15% 16% 7% 7% 25% 22% Lake Elkhorn MS 7% 7% 53% 53% 14% 14% 8% 8% 17% 17% Lime Kiln MS 26% 25% 13% 14% 5% <5% 8% 8% 48% 49% Mayfield Woods MS 13% 13% 29% 30% 18% 19% 6% 6% 33% 32% Mount View MS 32% 34% 6% 6% <5% <5% <5% 5% 54% 53% Murray Hill MS 18% 18% 43% 43% 19% 19% 5% 5% 16% 16% Oakland Mills MS 5% 5% 40% 40% 21% 21% 9% 9% 25% 25% Patapsco MS 29% 29% 11% 11% 8% 8% <5% <5% 47% 47% Patuxent Valley MS 14% 14% 36% 36% 16% 16% 6% 6% 27% 27% Thomas Viaduct MS 14% 14% 45% 45% 18% 18% 5% 5% 17% 17% Wilde Lake MS 7% 6% 48% 47% 11% 11% 8% 8% 25% 27% Countywide Average American Indian/Alaska Native and Native Hawaiian/Other Pacific Islander are not shown as there is less than 5% population at each of the schools. "<5%" indicates a school with less than 5% population for the specified race/ethnicity. These percentages are calculated from Spring 2016 student data using geographic assignments, current and proposed attendance areas. These numbers may not exactly match other reported numbers due to differences in timing and methodology. White 20% 24% 10% 6% 39% Asian Black or African American Hispanic Two or more 32

slide-36
SLIDE 36

2017 Superintendent Recommendation for SY 2018‐19 Attendance Area Adjustments

Elementary School Base Proposed Atholton ES <5% <5% Bellows Spring ES 10% 10% Bollman Bridge ES 13% 13% Bryant Woods ES 5% 6% Bushy Park ES <5% <5% Centennial Lane ES 7% 7% Clarksville ES <5% <5% Clemens Crossing ES <5% <5% Cradlerock ES 8% 8% Dayton Oaks ES <5% <5% Deep Run ES 21% 22% Ducketts Lane ES 14% 16% Elkridge ES <5% <5% Forest Ridge ES 9% 6% Fulton ES 6% 6% Gorman Crossing ES 7% 7% Guilford ES 6% 6% Hammond ES 6% 6% Hollifield Station ES 15% 15% Ilchester ES <5% <5% Jeffers Hill ES 9% 9% Laurel Woods ES 10% 13% Lisbon ES <5% <5% Longfellow ES 9% 8% Manor Woods ES 10% 11% New ES #42 <5% 13% Northfield ES 6% 6% Phelps Luck ES 18% 18% Pointers Run ES <5% <5% Rockburn ES <5% <5% Running Brook ES 5% <5% St Johns Lane ES 8% 8% Stevens Forest ES 20% 20% Swansfield ES 6% 6% Talbott Springs ES 8% 8% Thunder Hill ES <5% <5% Triadelphia Ridge ES <5% <5% Veterans ES 12% 12% Waterloo ES 7% 7% Waverly ES <5% <5% West Friendship ES <5% 11% Worthington ES <5% <5% Countywide Average % ESOL Participation 8%

* In adherence with the Family Educational Rights and Privacy Act of 1974 (FERPA), which restricts access to student records, values <5% have been replaced with "<5%". ** These percentages are calculated from Spring 2016 student data using geographic assignment, aggregated by current and proposed attendance

  • areas. These numbers may not exactly

match other reported numbers due to differences in timing and methodology. *** This chart shows the % of students receiving English Second Language support living in each schools' attendance area before and after the proposed redistricting plan.

33

slide-37
SLIDE 37

2017 Superintendent Recommendation for SY 2018‐19 Attendance Area Adjustments

Middle School Base Proposed Bonnie Branch MS

5% 5%

Burleigh Manor MS

<5% <5%

Clarksville MS

<5% <5%

Dunloggin MS

<5% <5%

Elkridge Landing MS

<5% <5%

Ellicott Mills MS

<5% <5%

Folly Quarter MS

<5% <5%

Glenwood MS

<5% <5%

Hammond MS

<5% <5%

Harpers Choice MS

5% 6%

Lake Elkhorn MS

<5% <5%

Lime Kiln MS

<5% <5%

Mayfield Woods MS

<5% <5%

Mount View MS

<5% <5%

Murray Hill MS

<5% <5%

Oakland Mills MS

6% 6%

Patapsco MS

<5% <5%

Patuxent Valley MS

6% 6%

Thomas Viaduct MS

6% 6%

Wilde Lake MS

<5% <5%

Countywide Average % ESOL Participation 3%

* In adherence with the Family Educational Rights and Privacy Act of 1974 (FERPA), which restricts access to student records, values <5% have been replaced with "<5%". ** These percentages are calculated from Spring 2016 student data using geographic assignment, aggregated by current and proposed attendance

  • areas. These numbers may not exactly

match other reported numbers due to differences in timing and methodology. *** This chart shows the % of students receiving English Second Language support living in each schools' attendance area before and after the proposed redistricting plan.

34

slide-38
SLIDE 38

School Name Current Proposed School Name Current Proposed Atholton ES 15% 15% Bonnie Branch MS 27% 27% Bellows Spring ES 15% 15% Burleigh Manor MS 8% 8% Bollman Bridge ES 46% 46% Clarksville MS <5% <5% Bryant Woods ES 56% 51% Dunloggin MS 16% 16% Bushy Park ES <5% <5% Elkridge Landing MS 15% 15% Centennial Lane ES 5% 5% Ellicott Mills MS 10% 10% Clarksville ES <5% <5% Folly Quarter MS <5% <5% Clemens Crossing ES 9% 12% Glenwood MS 6% 6% Cradlerock ES 54% 54% Hammond MS 18% 18% Dayton Oaks ES 5% 5% Harpers Choice MS 46% 49% Deep Run ES 53% 54% Lake Elkhorn MS 47% 47% Ducketts Lane ES 40% 48% Lime Kiln MS <5% <5% Elkridge ES 26% 26% Mayfield Woods MS 34% 36% Forest Ridge ES 30% 30% Mount View MS 4% <5% Fulton ES <5% <5% Murray Hill MS 37% 37% Gorman Crossing ES 18% 18% Oakland Mills MS 49% 49% Guilford ES 53% 53% Patapsco MS 16% 16% Hammond ES 24% 24% Patuxent Valley MS 34% 34% Hollifield Station ES 23% 23% Thomas Viaduct MS 46% 46% Ilchester ES <5% <5% Wilde Lake MS 43% 42% Jeffers Hill ES 34% 34% Laurel Woods ES 57% 57% System‐wide total Lisbon ES 13% 13% Longfellow ES 47% 51% Manor Woods ES 7% 7% New ES #42 0% 36% Northfield ES 6% 6% Phelps Luck ES 63% 63% Pointers Run ES <5% <5% Rockburn ES 17% 6% Running Brook ES 48% 47% St Johns Lane ES 10% 11% Stevens Forest ES 67% 67% Swansfield ES 56% 56% Talbott Springs ES 50% 50% Thunder Hill ES 21% 21% Triadelphia Ridge ES <5% <5% Veterans ES 24% 24% Waterloo ES 26% 24% Waverly ES <5% <5% West Friendship ES 5% <5% Worthington ES 5% 5% System‐wide total 22% 24% Recommendation for SY 2018‐19 Redistricting % of students on FARMs by school

35

slide-39
SLIDE 39

10/3/17 Assessment - Superintendent Recommendation OVERALL Summary Current Aggregate Plan Assessment Criteria # of Schools Strengthened NA 23 # of Schools Weakened NA 2 Mean 5.0 6.5 STRENGTH NA

  • 0.01

(pos=savings; neg=cost) WEAKNESS # of Schools Strengthened NA 13 # of Schools Weakened NA 16 Mean 7304 7508 WEAKNESS # of Schools Strengthened NA # of Schools Weakened NA 1 NEGLIGIBLE # of Small Feeds 27 27 NEGLIGIBLE # of Double Small Feeds 1 2 WEAKNESS Number of "Islands" 4 6 WEAKNESS Number NA % of Enrollment NA 0.0% Number moved in NA 2235 Number moved out NA 2235

Strength Negligible Weakness

Students in walk area, percentage of change Mean 2% increase or more = STRENGTH; decreased by 2% or more = WEAKNESS; otherwise Negligible Years between 90-110% Mean increased by 1.0 or more = STRENGTH; reduced by 1.0 or more = WEAKNESS; otherwise Negligible Transportation Cost Change Mean increased = STRENGTH; mean reduced = WEAKNESS; otherwise Negligible Proximity to school Mean reduced by 100 or more = STRENGTH; increased by 100 or more = WEAKNESS; otherwise Negligible (smaller # = closer set of polygons) Students Moved Take into account the correlation between the number of students moved, the outcomes of other standards achieved in Section IV.B. and the length

  • f time those results are expected to be

maintained. Students moved within 5 yrs

  • f last ES move, 2 years of

last MS move, or 3 years of last HS move Small Feeds (under 15%) "After" count lower than "Before" = STRENGTH; "After" higher = WEAKNESS; otherwise Negligible Double Small Feed "After" count lower than "Before" = STRENGTH; "After" higher = WEAKNESS; otherwise Negligible Non-contiguous Attendance Areas "After" count lower than "Before" = STRENGTH; "After" higher = WEAKNESS; otherwise Negligible

36

slide-40
SLIDE 40

10/3/17 Assessment - Superintendent Recommendation Elementary School Summary Current Aggregate Plan Assessment Criteria # of Schools Strengthened NA 18 # of Schools Weakened NA 2 Mean 4.1 6.0 STRENGTH NA

  • 0.02

(pos=savings; neg=cost) WEAKNESS # of Schools Strengthened NA 9 # of Schools Weakened NA 11 Mean 5565 5883 WEAKNESS # of Schools Strengthened NA # of Schools Weakened NA 1 WEAKNESS # of Double Small Feeds 1 2 WEAKNESS Number of "Islands" 4 6 WEAKNESS Number NA % of Enrollment NA 0.0% Number moved in NA 1922 Number moved out NA 1922

Strength Negligible Weakness

Students in walk area, percentage of change Mean 2% increase or more = STRENGTH; decreased by 2% or more = WEAKNESS; otherwise Negligible Students Moved Take into account the correlation between the number of students moved, the outcomes of other standards achieved in Section IV.B. and the length

  • f time those results are expected to be

maintained. Students moved within 5 yrs of last ES move Feed information in middle and high school sections. "After" count lower than "Before" = STRENGTH; "After" higher = WEAKNESS; otherwise Negligible Double Small Feed Non-contiguous Attendance Areas Small MS from ES Feeds (under 15%) "After" count lower than "Before" = STRENGTH; "After" higher = WEAKNESS; otherwise Negligible Years between 90-110% Mean increased by 1.0 or more = STRENGTH; reduced by 1.0 or more = WEAKNESS; otherwise Negligible Proximity to school Mean reduced by 100 or more = STRENGTH; increased by 100 or more = WEAKNESS; otherwise Negligible (smaller # = closer set of polygons) Transportation Cost Change Mean increased = STRENGTH; mean reduced = WEAKNESS; otherwise Negligible

37

slide-41
SLIDE 41

10/3/17 Assessment - Superintendent Recommendation Middle School Summary Current Aggregate Plan Assessment Criteria # of Schools Strengthened NA 5 # of Schools Weakened NA Mean 6.9 8.2 STRENGTH NA 0.00 (pos=savings; neg=cost) NEGLIGIBLE # of Schools Strengthened NA 4 # of Schools Weakened NA 5 Mean 8229 8313 NEGLIGIBLE # of Schools Strengthened NA # of Schools Weakened NA NEGLIGIBLE # of Small Feeds 19 17 STRENGTH # of Double Small Feeds 1 2 WEAKNESS Number of "Islands" NEGLIGIBLE Number NA % of Enrollment NA 0.0% Number moved in NA 313 Number moved out NA 313

Strength Negligible Weakness

Students in walk area, percentage of change Mean 2% increase or more = STRENGTH; decreased by 2% or more = WEAKNESS; otherwise Negligible Years between 90-110% Mean increased by 1.0 or more = STRENGTH; reduced by 1.0 or more = WEAKNESS; otherwise Negligible Transportation Cost Change Mean increased = STRENGTH; mean reduced = WEAKNESS; otherwise Negligible Proximity to school Mean reduced by 100 or more = STRENGTH; increased by 100 or more = WEAKNESS; otherwise Negligible (smaller # = closer set of polygons) Students Moved Take into account the correlation between the number of students moved, the outcomes of other standards achieved in Section IV.B. and the length

  • f time those results are expected to be

maintained. Students moved within 5 yrs

  • f last ES move

Small MS from ES Feeds (under 15%) "After" count lower than "Before" = STRENGTH; "After" higher = WEAKNESS; otherwise Negligible Double Small Feed "After" count lower than "Before" = STRENGTH; "After" higher = WEAKNESS; otherwise Negligible Non-contiguous Attendance Areas "After" count lower than "Before" = STRENGTH; "After" higher = WEAKNESS; otherwise Negligible

38

slide-42
SLIDE 42

School Programs School Programs Atholton ES Pre-K, Preschool, MINC Bonnie Branch MS Bellows Spring ES Pre-K, Preschool, MINC, EB, ES PL Burleigh Manor MS Bollman Bridge ES Title I, Pre-K, Preschool, MINC Clarksville MS Bryant Woods ES Title I, ESM Full-day Pre-K Dunloggin MS Bushy Park ES Pre-K, Preschool Elkridge Landing MS ALS Centennial Lane ES Ellicott Mills MS Regional ED Clarksville ES Folly Quarter MS Clemens Crossing ES Glenwood MS Cradlerock ES Title I, Pre-K, Preschool Hammond MS Dayton Oaks ES Pre-K, Preschool, MINC, EB Harper's Choice MS Deep Run ES Title I, Pre-K, Preschool, MINC Lake Elkhorn MS Ducketts Lane ES Lime Kiln MS ALS Elkridge ES Pre-K Mayfield Woods MS Forest Ridge ES Mount View MS Fulton ES Regional ED Murray Hill MS Regional ED Gorman Crossing ES Pre-K, Preschool, MINC Oakland Mills MS Guilford ES Title I, Pre-K Patapsco MS Hammond ES Patuxent Valley MS Hollifield Station ES Pre-K, Preschool, MINC Thomas Viaduct MS Ilchester ES Pre-K, Preschool, MINC, ES PL Wilde Lake MS Jeffers Hill ES Laurel Woods ES Title I, ESM Full-day Pre-K Lisbon ES Longfellow ES Title I, Pre-K, Preschool, MINC Manor Woods ES School Programs New ES #42 Atholton HS JROTC, PSECDP Northfield ES Centennial HS Phelps Luck ES Title I, ESM Full-day Pre-K Glenelg HS Pointers Run ES Pre-K, Preschool, MINC, ES PL, ALS Hammond HS Regional ED Rockburn ES Pre-K, Preschool, MINC Howard HS JROTC Running Brook ES Title I, ESM Full-day Pre-K, Preschool Long Reach HS PSECDP

  • St. John's Lane ES

Marriotts Ridge HS PSECDP Stevens Forest ES Title I, ESM Full-day Pre-K, Regional ED Mt Hebron HS Regional ED Swansfield ES Title I, Pre-K Oakland Mills HS ALS, JROTC, PSECDP Talbott Springs ES Title I, ESM Full-day Pre-K Reservoir HS Regional ED Thunder Hill ES ALS River Hill HS PSECDP Triadelphia Ridge ES EB Wilde Lake HS PPS Veterans ES EB, Pre-K, Preschool, MINC Waterloo ES Pre-K, Regional ED, Preschool, MINC Waverly ES Pre-K, ALS, Preschool, MINC, ES PL West Friendship ES Worthington ES ALS Regional Academic Life Skills Preschool Preschool Program, including Parent Assisted Learning at Schools Pre-K Income qualifying Pre-K program. Astrisk (*) indicates 300% poverty qualification. ESM Full-day Pre-K Elementary School Model Full-day Pre-K program EB Early Beginnings - Special Education services for very young children Title I State approved based upon income Regional ED Regional Emotional Disabilities Program (draws from other schools) Construction Swing space for year round construction project MINC Multiple Intensive Needs Classroom (Toddler, Preschool/K, and/or Early Learner) ES PL Elementary School Primary Learner Program JROTC Junior Reserve Officers Training Corps PPS Pregnant and Parenting Students PSECDP Public School Employees' Child Development Program

Regional Program Locations

39

slide-43
SLIDE 43

40

slide-44
SLIDE 44
  • XIII. Pre- and Post-Measures

On the following pages the effect of the proposed plans on capacity utilization are depicted in tabular form. The pre-measures and post-measures charts starting show long-term impact to capacity utilization. Pre-measures show the effect of projected enrollment without any redistricting, coupled with FY19 Capital Budget projects as approved. Post-measures show the impact of projected enrollment within the redistricting plan and include capital projects recommended in the Superintendent’s FY19 Capital Budget.

41

slide-45
SLIDE 45

Pre-Measures (Base)

Pre-Measures Chart reflects May 2017 Projections, Board of Education's FY 2018 approved capacities, and no redistricting. Columbia - East 2018 2019 2020 2021 Proj % Util. Proj % Util. Proj % Util. Proj % Util. Proj % Util. Proj % Util. Proj % Util. Proj % Util. Proj % Util. Proj % Util. Proj % Util. Cradlerock ES 398 398 398 398 416 104.5 394 99.0 380 95.5 374 94.0 351 88.2 363 91.2 363 91.2 368 92.5 374 94.0 377 94.7 383 96.2 Jeffers Hill ES 421 421 421 421 439 104.3 439 104.3 430 102.1 437 103.8 432 102.6 434 103.1 434 103.1 441 104.8 450 106.9 455 108.1 460 109.3 Phelps Luck ES 616 616 616 616 584 94.8 613 99.5 638 103.6 654 106.2 664 107.8 676 109.7 682 110.7 691 112.2 714 115.9 C 720 116.9 C 727 118.0 C Stevens Forest ES 399 399 399 399 401 100.5 395 99.0 406 101.8 410 102.8 424 106.3 420 105.3 416 104.3 422 105.8 434 108.8 436 109.3 438 109.8 Talbott Springs ES 377 377 377 377 446 118.3 C 455 120.7 C 456 121.0 C 449 119.1 C 436 115.6 C 439 116.4 C 447 118.6 C 444 117.8 C 449 119.1 C 454 120.4 C 461 122.3 C Thunder Hill ES 509 509 509 509 544 106.9 525 103.1 511 100.4 513 100.8 507 99.6 499 98.0 504 99.0 508 99.8 509 100.0 515 101.2 521 102.4 Region Totals 2720 2720 2720 2720 2830 104.0 2821 103.7 2821 103.7 2837 104.3 2814 103.5 2831 104.1 2846 104.6 2874 105.7 2930 107.7 2957 108.7 2990 109.9 Columbia - West Bryant Woods ES 361 361 361 361 420 116.3 C 421 116.6 C 417 115.5 C 416 115.2 C 404 111.9 406 112.5 404 111.9 410 113.6 414 114.7 418 115.8 C 418 115.8 C Clemens Crossing ES 521 521 521 521 576 110.6 609 116.9 C 652 125.1 C 670 128.6 C 694 133.2 C 723 138.8 C 735 141.1 C 781 149.9 C 801 153.7 C 821 157.6 C 830 159.3 C Longfellow ES 512 512 512 512 412 80.5 400 78.1 393 76.8 385 75.2 392 76.6 390 76.2 388 75.8 396 77.3 401 78.3 406 79.3 412 80.5 New ES #44

NS

Running Brook ES 515 515 515 515 555 107.8 600 116.5 C 641 124.5 C 701 136.1 C 771 149.7 C 833 161.7 C 882 171.3 C 927 180.0 C 981 190.5 C 1032 200.4 C 1071 208.0 C Swansfield ES

A

621 621 621 621 636 102.4 634 102.1 645 103.9 644 103.7 658 106.0 663 106.8 665 107.1 673 108.4 682 109.8 688 110.8 700 112.7 Region Totals 2530 2530 2530 2530 2599 102.7 2664 105.3 2748 108.6 2816 111.3 2919 115.4 C 3015 119.2 C 3074 121.5 C 3187 126.0 C 3279 129.6 C 3365 101.4 3431 103.4 Northeastern Bellows Spring ES 751 751 751 751 744 99.1 780 103.9 852 113.4 885 117.8 C 936 124.6 C 964 128.4 C 1002 133.4 C 1010 134.5 C 979 130.4 C 962 128.1 C 945 125.8 C Deep Run ES 772 772 772 772 794 102.8 815 105.6 851 110.2 892 115.5 C 917 118.8 C 954 123.6 C 976 126.4 C 1002 129.8 C 991 128.4 C 1005 130.2 C 1013 131.2 C Ducketts Lane ES 770 770 770 770 1030 133.8 C 1166 151.4 C 1291 167.7 C 1454 188.8 C 1589 206.4 C 1639 212.9 C 1681 218.3 C 1687 219.1 C 1688 219.2 C 1692 219.7 C 1675 217.5 C Elkridge ES 760 760 760 760 829 109.1 796 104.7 786 103.4 770 101.3 739 97.2 719 94.6 738 97.1 780 102.6 807 106.2 852 112.1 868 114.2 Ilchester ES 653 653 653 653 569 87.1 544 83.3 536 82.1 527 80.7 546 83.6 592 90.7 622 95.3 663 101.5 696 106.6 708 108.4 736 112.7 New ES #42

NS

788 788 788 788 Rockburn ES 653 653 653 653 689 105.5 710 108.7 753 115.3 C 761 116.5 C 767 117.5 C 779 119.3 C 808 123.7 C 851 130.3 C 856 131.1 C 887 135.8 C 927 142.0 C Veterans ES 821 821 821 821 886 107.9 896 109.1 905 110.2 900 109.6 886 107.9 874 106.5 882 107.4 869 105.8 867 105.6 923 112.4 944 115.0 Waterloo ES 663 663 663 663 559 84.3 530 79.9 544 82.1 539 81.3 552 83.3 551 83.1 547 82.5 556 83.9 562 84.8 568 85.7 584 88.1 Worthington ES 590 590 590 590 465 78.8 423 71.7 415 70.3 402 68.1 408 69.2 423 71.7 442 74.9 471 79.8 481 81.5 492 83.4 547 92.7 Region Totals 7221 7221 7221 7221 6565 90.9 6660 92.2 6933 96.0 7130 98.7 7340 101.6 7495 103.8 7698 106.6 7889 109.3 7927 109.8 8089 112.0 8239 114.1 Northern Centennial Lane ES 647 647 647 647 738 114.1 740 114.4 744 115.0 738 114.1 741 114.5 721 111.4 718 111.0 718 111.0 713 110.2 718 111.0 726 112.2 Hollifield Station ES 694 694 694 694 796 114.7 806 116.1 C 842 121.3 C 841 121.2 C 827 119.2 C 814 117.3 C 842 121.3 C 834 120.2 C 830 119.6 C 851 122.6 C 869 125.2 C Manor Woods ES 681 681 681 681 862 126.6 C 947 139.1 C 1042 153.0 C 1147 168.4 C 1249 183.4 C 1350 198.2 C 1412 207.3 C 1446 212.3 C 1459 214.2 C 1446 212.3 C 1405 206.3 C New ES #45

NS

Northfield ES 700 700 700 700 744 106.3 739 105.6 742 106.0 753 107.6 750 107.1 737 105.3 736 105.1 748 106.9 753 107.6 778 111.1 779 111.3 St Johns Lane ES 612 612 612 612 718 117.3 C 730 119.3 C 734 119.9 C 739 120.8 C 762 124.5 C 789 128.9 C 821 134.2 C 856 139.9 C 852 139.2 C 857 140.0 C 863 141.0 C Waverly ES

A

738 738 738 738 686 93.0 671 90.9 659 89.3 632 85.6 611 82.8 607 82.2 607 82.2 622 84.3 624 84.6 632 85.6 641 86.9 Region Totals 4072 4072 4072 4072 4544 111.6 4633 113.8 4763 117.0 C 4850 119.1 C 4940 121.3 C 5018 123.2 C 5136 126.1 C 5224 128.3 C 5231 128.5 C 5282 129.7 C 5283 129.7 C Southeastern Atholton ES 424 424 424 424 455 107.3 457 107.8 460 108.5 447 105.4 418 98.6 416 98.1 414 97.6 414 97.6 412 97.2 415 97.9 418 98.6 Bollman Bridge ES 666 666 666 666 707 106.2 717 107.7 741 111.3 757 113.7 761 114.3 772 115.9 C 784 117.7 C 776 116.5 C 768 115.3 C 767 115.2 C 768 115.3 C Forest Ridge ES 713 713 713 713 701 98.3 713 100.0 756 106.0 776 108.8 813 114.0 852 119.5 C 894 125.4 C 918 128.8 C 952 133.5 C 953 133.7 C 945 132.5 C Gorman Crossing ES 735 735 735 735 760 103.4 792 107.8 798 108.6 836 113.7 839 114.1 830 112.9 803 109.3 803 109.3 809 110.1 790 107.5 774 105.3 Guilford ES 465 465 465 465 432 92.9 434 93.3 413 88.8 410 88.2 414 89.0 415 89.2 451 97.0 484 104.1 488 104.9 482 103.7 483 103.9 Hammond ES 653 653 653 653 644 98.6 649 99.4 644 98.6 661 101.2 705 108.0 792 121.3 C 830 127.1 C 874 133.8 C 923 141.3 C 971 148.7 C 1038 159.0 C Laurel Woods ES 640 640 640 640 528 82.5 514 80.3 491 76.7 482 75.3 469 73.3 462 72.2 459 71.7 449 70.2 467 73.0 473 73.9 479 74.8 New ES #43

NS

Region Totals 4296 4296 4296 4296 4227 98.4 4276 99.5 4303 100.2 4369 101.7 4419 102.9 4539 89.3 4635 91.2 4718 92.8 4819 94.8 4851 95.4 4905 96.5 Western Bushy Park ES 788 788 788 788 571 72.5 550 69.8 546 69.3 507 64.3 499 63.3 483 61.3 478 60.7 490 62.2 494 62.7 514 65.2 551 69.9 Clarksville ES 612 612 612 612 408 66.7 414 67.6 409 66.8 413 67.5 429 70.1 409 66.8 410 67.0 416 68.0 422 69.0 425 69.4 425 69.4 Dayton Oaks ES 788 788 788 788 591 75.0 588 74.6 594 75.4 606 76.9 582 73.9 588 74.6 588 74.6 590 74.9 569 72.2 565 71.7 563 71.4 Fulton ES 788 788 788 788 920 116.8 C 984 124.9 C 1051 133.4 C 1099 139.5 C 1111 141.0 C 1123 142.5 C 1119 142.0 C 1087 137.9 C 1053 133.6 C 1018 129.2 C 980 124.4 C Lisbon ES 527 527 527 527 451 85.6 440 83.5 430 81.6 424 80.5 417 79.1 421 79.9 425 80.6 460 87.3 482 91.5 506 96.0 519 98.5 Pointers Run ES 744 744 744 744 705 94.8 699 94.0 711 95.6 755 101.5 795 106.9 814 109.4 824 110.8 830 111.6 824 110.8 799 107.4 770 103.5 Triadelphia Ridge ES 581 581 581 581 569 97.9 571 98.3 555 95.5 573 98.6 578 99.5 580 99.8 578 99.5 575 99.0 575 99.0 573 98.6 568 97.8 West Friendship ES 414 414 414 414 334 80.7 326 78.7 352 85.0 347 83.8 370 89.4 399 96.4 405 97.8 410 99.0 403 97.3 404 97.6 406 98.1 Region Totals 5242 5242 5242 5242 4549 86.8 4572 87.2 4648 88.7 4724 90.1 4781 91.2 4817 91.9 4827 92.1 4858 92.7 4822 92.0 4804 91.6 4782 91.2 Countywide Totals 26081 26081 26081 26081 25314 97.1 25626 98.3 26216 100.5 26726 102.5 27213 104.3 27715 103.1 28216 105.0 28750 107.0 29008 108.0 29348 106.1 29630 107.1 2019-20 2020-21 'A' includes additions as reflected in FY 2018 CIP for grades K-5 'NS' New School proposed in FY 2018 Capital Budget

ELEMENTARY SCHOOLS - Data for Demonstrative Purposes Only Capacity Utilization Rates with Board of Education's Approved FY 2018 Capital Budget Projects - Not Test for APFO

2025-26 2026-27 2027-28 2028-29 2021-22 2022-23 2023-24 2024-25 Capacity 2018-19

10/2/2017

42

slide-46
SLIDE 46

Post-Measures Aggregate Plan Columbia - East 2018 2019 2020 2021 Proj % Util. Proj % Util. Proj % Util. Proj % Util. Proj % Util. Proj % Util. Proj % Util. Proj % Util. Proj % Util. Proj % Util. Proj % Util. Cradlerock ES 398 398 398 398 408 102.5 399 100.3 382 96.0 375 94.2 353 88.7 363 91.2 364 91.5 369 92.7 375 94.2 379 95.2 385 96.7 Jeffers Hill ES 421 421 421 421 439 104.3 439 104.3 430 102.1 437 103.8 432 102.6 434 103.1 434 103.1 441 104.8 450 106.9 455 108.1 460 109.3 Phelps Luck ES 616 616 616 616 584 94.8 612 99.4 637 103.4 653 106.0 663 107.6 676 109.7 682 110.7 690 112.0 713 115.7 C 720 116.9 C 727 118.0 C Stevens Forest ES 399 399 399 399 401 100.5 395 99.0 406 101.8 410 102.8 424 106.3 419 105.0 416 104.3 422 105.8 434 108.8 436 109.3 437 109.5 Talbott Springs ES Repl 377 377 377 540 447 118.6 C 455 120.7 C 456 121.0 C 449 83.1 437 80.9 439 81.3 447 82.8 445 82.4 449 83.1 454 84.1 460 85.2 Thunder Hill ES 509 509 509 509 545 107.1 525 103.1 511 100.4 514 101.0 507 99.6 499 98.0 504 99.0 509 100.0 510 100.2 515 101.2 521 102.4 Region Totals 2720 2720 2720 2883 2824 103.8 2825 103.9 2822 103.8 2838 98.4 2816 97.7 2830 98.2 2847 98.8 2876 99.8 2931 101.7 2959 102.6 2990 103.7 Columbia - West Bryant Woods ES 361 361 361 361 332 92.0 337 93.4 337 93.4 339 93.9 339 93.9 345 95.6 344 95.3 347 96.1 350 97.0 353 97.8 355 98.3 Clemens Crossing ES 521 521 521 521 398 76.4 441 84.6 493 94.6 533 102.3 586 112.5 638 122.5 C 674 129.4 C 714 137.0 C 732 140.5 C 742 142.4 C 754 144.7 C Longfellow ES 512 512 512 512 570 111.3 557 108.8 550 107.4 541 105.7 543 106.1 544 106.3 540 105.5 551 107.6 557 108.8 564 110.2 569 111.1 New ES #44

NS

Running Brook ES 515 515 515 515 470 91.3 490 95.1 504 97.9 535 103.9 569 110.5 597 115.9 C 618 120.0 C 637 123.7 C 688 133.6 C 738 143.3 C 775 150.5 C Swansfield ES 621 621 621 621 636 102.4 635 102.3 646 104.0 644 103.7 659 106.1 664 106.9 666 107.2 673 108.4 682 109.8 690 111.1 701 112.9 Region Totals 2530 2530 2530 2530 2406 95.1 2460 97.2 2530 100.0 2592 102.5 2696 106.6 2788 110.2 2842 112.3 2922 115.5 C 3009 118.9 C 3087 93.0 3154 95.1 Northeastern Bellows Spring ES 751 751 751 751 658 87.6 687 91.5 746 99.3 779 103.7 825 109.9 858 114.2 884 117.7 C 892 118.8 C 866 115.3 C 853 113.6 841 112.0 Deep Run ES 772 772 772 772 724 93.8 744 96.4 784 101.6 819 106.1 842 109.1 867 112.3 887 114.9 919 119.0 C 919 119.0 C 941 121.9 C 977 126.6 C Ducketts Lane ES 770 770 770 770 611 79.4 669 86.9 722 93.8 777 100.9 839 109.0 854 110.9 866 112.5 870 113.0 851 110.5 840 109.1 814 105.7 Elkridge ES 760 760 760 760 829 109.1 796 104.7 786 103.4 771 101.4 740 97.4 720 94.7 739 97.2 780 102.6 808 106.3 853 112.2 869 114.3 Ilchester ES 653 653 653 653 564 86.4 540 82.7 531 81.3 522 79.9 541 82.8 587 89.9 618 94.6 658 100.8 691 105.8 703 107.7 731 111.9 New ES #42

NS

832 832 832 832 624 75.0 706 84.9 791 95.1 906 108.9 980 117.8 C 1019 122.5 C 1050 126.2 C 1066 128.1 C 1084 130.3 C 1108 133.2 C 1119 134.5 C Rockburn ES 653 653 653 653 568 87.0 587 89.9 619 94.8 628 96.2 635 97.2 650 99.5 691 105.8 715 109.5 711 108.9 719 110.1 727 111.3 Veterans ES 799 799 799 799 887 111.0 897 112.3 906 113.4 901 112.8 887 111.0 876 109.6 882 110.4 870 108.9 868 108.6 925 115.8 C 945 118.3 C Waterloo ES 663 663 663 663 630 95.0 606 91.4 627 94.6 622 93.8 637 96.1 637 96.1 633 95.5 643 97.0 646 97.4 651 98.2 663 100.0 Worthington ES 515 515 515 515 466 90.5 424 82.3 416 80.8 403 78.3 409 79.4 425 82.5 443 86.0 473 91.8 483 93.8 493 95.7 549 106.6 Region Totals 7168 7168 7168 7168 6561 91.5 6656 92.9 6928 96.7 7128 99.4 7335 102.3 7493 104.5 7693 107.3 7886 110.0 7927 110.6 8086 112.8 8235 114.9 Northern Centennial Lane ES 647 647 647 647 738 114.1 741 114.5 744 115.0 738 114.1 741 114.5 721 111.4 718 111.0 718 111.0 713 110.2 719 111.1 727 112.4 Hollifield Station ES 732 732 732 732 796 108.7 806 110.1 843 115.2 C 842 115.0 C 828 113.1 814 111.2 842 115.0 C 834 113.9 830 113.4 851 116.3 C 870 118.9 C Manor Woods ES 681 681 681 681 604 88.7 633 93.0 668 98.1 711 104.4 763 112.0 810 118.9 C 822 120.7 C 823 120.9 C 829 121.7 C 816 119.8 C 792 116.3 C New ES #45

NS

Northfield ES 700 700 700 700 743 106.1 739 105.6 741 105.9 753 107.6 750 107.1 737 105.3 735 105.0 746 106.6 752 107.4 777 111.0 778 111.1 St Johns Lane ES 612 612 612 612 598 97.7 608 99.3 610 99.7 615 100.5 636 103.9 660 107.8 660 107.8 695 113.6 693 113.2 697 113.9 701 114.5 Waverly ES

A

760 760 760 760 818 107.6 805 105.9 798 105.0 773 101.7 756 99.5 757 99.6 787 103.6 809 106.4 810 106.6 818 107.6 826 108.7 Region Totals 4132 4132 4132 4132 4297 104.0 4332 104.8 4404 106.6 4432 107.3 4474 108.3 4499 108.9 4564 110.5 4625 111.9 4627 112.0 4678 113.2 4694 113.6 Southeastern Atholton ES 424 424 424 424 455 107.3 457 107.8 460 108.5 448 105.7 419 98.8 417 98.3 415 97.9 414 97.6 413 97.4 415 97.9 418 98.6 Bollman Bridge ES 666 666 666 666 707 106.2 718 107.8 741 111.3 757 113.7 762 114.4 772 115.9 C 785 117.9 C 777 116.7 C 769 115.5 C 768 115.3 C 769 115.5 C Forest Ridge ES 713 713 713 713 705 98.9 716 100.4 760 106.6 780 109.4 817 114.6 856 120.1 C 898 125.9 C 923 129.5 C 956 134.1 C 958 134.4 C 950 133.2 C Gorman Crossing ES 735 735 735 735 757 103.0 789 107.3 795 108.2 833 113.3 835 113.6 827 112.5 800 108.8 800 108.8 806 109.7 788 107.2 770 104.8 Guilford ES 465 465 465 465 434 93.3 436 93.8 415 89.2 413 88.8 416 89.5 417 89.7 454 97.6 487 104.7 490 105.4 485 104.3 485 104.3 Hammond ES 653 653 653 653 646 98.9 650 99.5 646 98.9 663 101.5 707 108.3 794 121.6 C 832 127.4 C 876 134.2 C 924 141.5 C 972 148.9 C 1040 159.3 C Laurel Woods ES 640 640 640 640 528 82.5 514 80.3 491 76.7 482 75.3 469 73.3 462 72.2 460 71.9 449 70.2 467 73.0 472 73.8 479 74.8 New ES #43

NS

Region Totals 4296 4296 4296 4296 4232 98.5 4280 99.6 4308 100.3 4376 101.9 4425 103.0 4545 89.4 4644 91.3 4726 93.0 4825 94.9 4858 95.6 4911 96.6 Western Bushy Park ES 788 788 788 788 672 85.3 706 89.6 761 96.6 783 99.4 824 104.6 862 109.4 898 114.0 936 118.8 C 945 119.9 C 962 122.1 C 987 125.3 C Clarksville ES 543 543 543 543 498 91.7 501 92.3 493 90.8 497 91.5 515 94.8 495 91.2 497 91.5 503 92.6 510 93.9 507 93.4 505 93.0 Dayton Oaks ES 769 769 769 769 624 81.1 641 83.4 636 82.7 698 90.8 673 87.5 679 88.3 679 88.3 684 88.9 662 86.1 655 85.2 648 84.3 Fulton ES 826 826 826 826 921 111.5 985 119.2 C 1052 127.4 C 1100 133.2 C 1112 134.6 C 1124 136.1 C 1120 135.6 C 1087 131.6 C 1054 127.6 C 1019 123.4 C 981 118.8 C Lisbon ES 527 527 527 527 495 93.9 483 91.7 472 89.6 463 87.9 456 86.5 458 86.9 461 87.5 496 94.1 520 98.7 548 104.0 561 106.5 Pointers Run ES 744 744 744 744 776 104.3 774 104.0 792 106.5 826 111.0 851 114.4 872 117.2 C 885 119.0 C 923 124.1 C 922 123.9 C 913 122.7 C 889 119.5 C Triadelphia Ridge ES 581 581 581 581 639 110.0 642 110.5 628 108.1 647 111.4 654 112.6 657 113.1 665 114.5 661 113.8 661 113.8 658 113.3 651 112.0 West Friendship ES 414 414 414 414 367 88.6 358 86.5 381 92.0 376 90.8 398 96.1 427 103.1 432 104.3 441 106.5 433 104.6 433 104.6 436 105.3 Region Totals 5192 5192 5192 5192 4992 96.1 5090 98.0 5215 100.4 5390 103.8 5483 105.6 5574 107.4 5637 108.6 5731 110.4 5707 109.9 5695 109.7 5658 109.0 Countywide Totals 26038 26038 26038 26201 25312 97.2 25643 98.5 26207 100.6 26756 102.1 27229 103.9 27729 102.7 28227 104.6 28766 106.6 29026 107.5 29363 105.7 29642 106.7

ELEMENTARY SCHOOLS - Data for Demonstrative Purposes Only Capacity Utilization Rates with Proposed FY 2019 Capital Budget Projects - Not Test for APFO

2025-26 2026-27 2027-28 2028-29 2021-22 2022-23 Chart reflects May 2017 Projections, potential FY 2019 requested capacities and estimated redistricting. 'A' includes additions as reflected in FY 2019 CIP for grades K-5 'NS' New School proposed in FY 2019 Capital Budget 2023-24 2024-25 Capacity 2018-19 2019-20 2020-21

43

slide-47
SLIDE 47

Pre-Measures (Base)

Pre-Measures Chart reflects May 2017 Projections, Board of Education's FY 2018 approved capacities, and no redistricting. Columbia - East 2018 2019 2020 2021 Proj % Util. Proj % Util. Proj % Util. Proj % Util. Proj % Util. Proj % Util. Proj % Util. Proj % Util. Proj % Util. Proj % Util. Proj % Util. Lake Elkhorn MS 643 643 643 643 609 94.7 605 94.1 603 93.8 585 91.0 591 91.9 557 86.6 553 86.0 532 82.7 546 84.9 553 86.0 557 86.6 Oakland Mills MS 506 506 506 506 499 98.6 512 101.2 506 100.0 497 98.2 495 97.8 513 101.4 506 100.0 501 99.0 495 97.8 496 98.0 496 98.0 Region MS Totals 1149 1149 1149 1149 1108 96.4 1117 97.2 1109 96.5 1082 94.2 1086 94.5 1070 93.1 1059 92.2 1033 89.9 1041 90.6 1049 91.3 1053 91.6 Columbia - West Harpers Choice MS 506 506 506 506 572 113.0 573 113.2 567 112.1 585 115.6 C 562 111.1 570 112.6 573 113.2 590 116.6 C 596 117.8 C 590 116.6 C 597 118.0 C Wilde Lake MS Repl 760 760 760 760 590 77.6 634 83.4 652 85.8 673 88.6 705 92.8 732 96.3 792 104.2 847 111.4 891 117.2 C 911 119.9 C 936 123.2 C Region MS Totals 1266 1266 1266 1266 1162 91.8 1207 95.3 1219 96.3 1258 99.4 1267 100.1 1302 102.8 1365 107.8 1437 113.5 1487 117.5 C 1501 118.6 C 1533 121.1 C Northeastern Bonnie Branch MS 662 662 662 662 747 112.8 732 110.6 696 105.1 670 101.2 681 102.9 697 105.3 703 106.2 702 106.0 719 108.6 732 110.6 761 115.0 Elkridge Landing MS 779 779 779 779 704 90.4 710 91.1 688 88.3 720 92.4 734 94.2 747 95.9 732 94.0 716 91.9 740 95.0 767 98.5 789 101.3 Ellicott Mills MS A 701 701 701 701 897 128.0 C 943 134.5 C 919 131.1 C 906 129.2 C 857 122.3 C 858 122.4 C 827 96.5 810 94.5 801 93.5 814 95.0 854 99.6 Mayfield Woods MS 798 798 798 798 745 93.4 809 101.4 843 105.6 864 108.3 843 105.6 858 107.5 900 112.8 929 116.4 C 1003 125.7 C 1020 127.8 C 1057 132.5 C Thomas Viaduct MS 701 701 701 701 662 94.4 716 102.1 798 113.8 839 119.7 C 877 125.1 C 973 138.8 C 1103 157.3 C 1247 177.9 C 1327 189.3 C 1379 196.7 C 1427 203.6 C Region MS Totals 3641 3641 3641 3641 3755 103.1 3910 107.4 3944 108.3 3999 109.8 3992 109.6 4133 113.5 4265 112.3 4404 116.0 C 4590 120.9 C 4712 124.1 C 4888 128.7 C Northern Burleigh Manor MS 779 779 779 779 808 103.7 820 105.3 859 110.3 858 110.1 865 111.0 886 113.7 925 118.7 C 965 123.9 C 971 124.6 C 976 125.3 C 971 124.6 C Dunloggin MS A 565 565 565 565 627 111.0 650 115.0 C 658 116.5 C 694 122.8 C 711 107.4 730 110.3 720 108.8 704 106.3 698 105.4 712 107.6 717 108.3 Patapsco MS 643 643 643 643 691 107.5 686 106.7 697 108.4 735 114.3 764 118.8 C 769 119.6 C 776 120.7 C 775 120.5 C 803 124.9 C 811 126.1 C 815 126.7 C Region MS Totals 1987 1987 1987 1987 2126 107.0 2156 108.5 2214 111.4 2287 115.1 C 2340 112.3 2385 114.4 2421 116.2 C 2444 117.3 C 2472 118.6 C 2499 119.9 C 2503 120.1 C Southeastern Hammond MS 604 604 604 604 551 91.2 570 94.4 608 100.7 612 101.3 661 109.4 693 114.7 706 116.9 C 705 116.7 C 722 119.5 C 732 121.2 C 743 123.0 C Murray Hill MS 662 662 662 662 706 106.6 738 111.5 791 119.5 C 769 116.2 C 754 113.9 737 111.3 781 118.0 C 778 117.5 C 774 116.9 C 751 113.4 746 112.7 Patuxent Valley MS 760 760 760 760 680 89.5 668 87.9 692 91.1 656 86.3 649 85.4 654 86.1 672 88.4 702 92.4 721 94.9 737 97.0 737 97.0 Region MS Totals 2026 2026 2026 2026 1937 95.6 1976 97.5 2091 103.2 2037 100.5 2064 101.9 2084 102.9 2159 106.6 2185 107.8 2217 109.4 2220 109.6 2226 109.9 Western Clarksville MS 643 643 643 643 515 80.1 532 82.7 524 81.5 503 78.2 477 74.2 476 74.0 477 74.2 510 79.3 493 76.7 501 77.9 495 77.0 Folly Quarter MS 662 662 662 662 621 93.8 639 96.5 634 95.8 628 94.9 616 93.1 605 91.4 608 91.8 599 90.5 602 90.9 590 89.1 592 89.4 Glenwood MS 545 545 545 545 520 95.4 548 100.6 544 99.8 534 98.0 502 92.1 492 90.3 477 87.5 484 88.8 506 92.8 517 94.9 539 98.9 Lime Kiln MS 701 701 701 701 737 105.1 773 110.3 777 110.8 789 112.6 829 118.3 C 836 119.3 C 848 121.0 C 856 122.1 C 899 128.2 C 921 131.4 C 911 130.0 C Mount View MS 798 798 798 798 822 103.0 840 105.3 857 107.4 886 111.0 906 113.5 929 116.4 C 969 121.4 C 971 121.7 C 1007 126.2 C 1000 125.3 C 1017 127.4 C Region MS Totals 3349 3349 3349 3349 3215 96.0 3332 99.5 3336 99.6 3340 99.7 3330 99.4 3338 99.7 3379 100.9 3420 102.1 3507 104.7 3529 105.4 3554 106.1 Countywide Totals 13418 13418 13418 13418 13303 99.1 13698 102.1 13913 103.7 14003 104.4 14079 104.2 14312 105.9 14648 107.1 14923 109.2 15314 112.0 15510 113.5 15757 115.3 Capacity 'NS' New School proposed in FY 2018 Capital Budget 'A' includes additions as reflected in FY 2018 CIP for grades 6-8

MIDDLE SCHOOLS - Data for Demonstrative Purposes Only Capacity Utilization Rates with Board of Education's Approved FY 2018 Capital Budget Projects - Not Test for APFO

2018-19 2019-20 2020-21 2021-22 2022-23 2023-24 2024-25 2025-26 2026-27 2027-28 2028-29

10/2/2017

44

slide-48
SLIDE 48

Post-Measures Aggregate Plan Columbia - East 2018 2019 2020 2021 Proj % Util. Proj % Util. Proj % Util. Proj % Util. Proj % Util. Proj % Util. Proj % Util. Proj % Util. Proj % Util. Proj % Util. Proj % Util. Lake Elkhorn MS 643 643 643 643 609 94.7 605 94.1 603 93.8 585 91.0 591 91.9 557 86.6 553 86.0 532 82.7 546 84.9 553 86.0 557 86.6 Oakland Mills MS 506 506 506 506 499 98.6 512 101.2 506 100.0 497 98.2 495 97.8 513 101.4 506 100.0 501 99.0 495 97.8 496 98.0 496 98.0 Region MS Totals 1149 1149 1149 1149 1108 96.4 1117 97.2 1109 96.5 1082 94.2 1086 94.5 1070 93.1 1059 92.2 1033 89.9 1041 90.6 1049 91.3 1053 91.6 Columbia - West Harpers Choice MS 506 506 506 506 525 103.8 526 104.0 519 102.6 534 105.5 511 101.0 517 102.2 520 102.8 534 105.5 540 106.7 534 105.5 539 106.5 Wilde Lake MS 760 760 760 760 607 79.9 647 85.1 665 87.5 687 90.4 716 94.2 743 97.8 800 105.3 855 112.5 895 117.8 C 913 120.1 C 939 123.6 C Region MS Totals 1266 1266 1266 1266 1132 89.4 1173 92.7 1184 93.5 1221 96.4 1227 96.9 1260 99.5 1320 104.3 1389 109.7 1435 113.3 1447 114.3 1478 116.7 C Northeastern Bonnie Branch MS 701 701 701 701 747 106.6 732 104.4 696 99.3 670 95.6 681 97.1 697 99.4 703 100.3 702 100.1 719 102.6 732 104.4 761 108.6 Elkridge Landing MS 779 779 779 779 737 94.6 746 95.8 726 93.2 760 97.6 773 99.2 787 101.0 774 99.4 761 97.7 788 101.2 817 104.9 841 108.0 Ellicott Mills MS A 701 701 701 701 897 128.0 C 943 134.5 C 919 131.1 C 906 129.2 C 857 100.0 858 100.1 827 96.5 810 94.5 801 93.5 814 95.0 854 99.6 Mayfield Woods MS 798 798 798 798 712 89.2 773 96.9 805 100.9 824 103.3 804 100.8 818 102.5 858 107.5 884 110.8 955 119.7 C 970 121.6 C 1005 125.9 C Thomas Viaduct MS 701 701 701 701 662 94.4 716 102.1 798 113.8 839 119.7 877 125.1 C 973 138.8 C 1103 157.3 C 1247 177.9 C 1327 189.3 C 1379 196.7 C 1427 203.6 C Region MS Totals 3680 3680 3680 3680 3755 102.0 3910 106.3 3944 107.2 3999 108.7 3992 104.1 4133 107.7 4265 111.2 4404 114.8 4590 119.7 C 4712 122.8 C 4888 127.4 C Northern Burleigh Manor MS 779 779 779 779 779 100.0 791 101.5 829 106.4 828 106.3 835 107.2 856 109.9 894 114.8 932 119.6 C 938 120.4 C 942 120.9 C 937 120.3 C Dunloggin MS A 565 565 565 565 627 111.0 650 115.0 C 658 116.5 C 694 122.8 C 711 107.4 730 110.3 720 108.8 704 106.3 698 105.4 712 107.6 717 108.3 Patapsco MS 643 643 643 643 691 107.5 686 106.7 697 108.4 735 114.3 764 118.8 C 769 119.6 C 776 120.7 C 775 120.5 C 803 124.9 C 811 126.1 C 815 126.7 C Region MS Totals 1987 1987 1987 1987 2097 105.5 2127 107.0 2184 109.9 2257 113.6 2310 110.8 2355 113.0 2390 114.7 2411 115.7 C 2439 117.0 C 2465 118.3 C 2469 118.5 C Southeastern Hammond MS 604 604 604 604 551 91.2 570 94.4 608 100.7 612 101.3 661 109.4 693 114.7 706 116.9 C 705 116.7 C 722 119.5 C 732 121.2 C 743 123.0 C Murray Hill MS 662 662 662 662 706 106.6 738 111.5 791 119.5 C 769 116.2 C 754 113.9 737 111.3 781 118.0 C 778 117.5 C 774 116.9 C 751 113.4 746 112.7 Patuxent Valley MS 760 760 760 760 680 89.5 668 87.9 692 91.1 656 86.3 649 85.4 654 86.1 672 88.4 702 92.4 721 94.9 737 97.0 737 97.0 Region MS Totals 2026 2026 2026 2026 1937 95.6 1976 97.5 2091 103.2 2037 100.5 2064 101.9 2084 102.9 2159 106.6 2185 107.8 2217 109.4 2220 109.6 2226 109.9 Western Clarksville MS 643 643 643 643 673 104.7 697 108.4 687 106.8 666 103.6 646 100.5 644 100.2 648 100.8 682 106.1 677 105.3 687 106.8 681 105.9 Folly Quarter MS 662 662 662 662 665 100.5 683 103.2 679 102.6 675 102.0 663 100.2 652 98.5 657 99.2 648 97.9 653 98.6 641 96.8 643 97.1 Glenwood MS 545 545 545 545 520 95.4 548 100.6 544 99.8 534 98.0 502 92.1 492 90.3 477 87.5 484 88.8 506 92.8 517 94.9 539 98.9 Lime Kiln MS 701 701 701 701 609 86.9 643 91.7 650 92.7 664 94.7 701 100.0 711 101.4 723 103.1 733 104.6 768 109.6 790 112.7 781 111.4 Mount View MS 798 798 798 798 807 101.1 824 103.3 841 105.4 868 108.8 888 111.3 911 114.2 950 119.0 C 954 119.5 C 988 123.8 C 982 123.1 C 999 125.2 C Region MS Totals 3349 3349 3349 3349 3274 97.8 3395 101.4 3401 101.6 3407 101.7 3400 101.5 3410 101.8 3455 103.2 3501 104.5 3592 107.3 3617 108.0 3643 108.8 Countywide Totals 13457 13457 13457 13457 13303 98.9 13698 101.8 13913 103.4 14003 104.1 14079 102.7 14312 104.4 14648 106.8 14923 108.8 15314 111.7 15510 113.1 15757 114.9 Chart reflects May 2017 Projections, potential FY 2019 requested capacities and estimated redistricting.

MIDDLE SCHOOLS - Data for Demonstrative Purposes Only Capacity Utilization Rates with Proposed FY 2019 Capital Budget Projects - Not Test for APFO

2018-19 2019-20 2020-21 2021-22 2022-23 2023-24 2028-29 2024-25 'A' includes additions as reflected in FY 2019 CIP for grades 6-8 Capacity 2025-26 2026-27 2027-28

45

slide-49
SLIDE 49

Pre-Measures (Base)

Pre-Measures Chart reflects May 2017 Projections, Board of Education's FY 2018 approved capacities, and no redistricting. Columbia - East 2018 2019 2020 2021 Proj % Util. Proj % Util. Proj % Util. Proj % Util. Proj % Util. Proj % Util. Proj % Util. Proj % Util. Proj % Util. Proj % Util. Proj % Util. Oakland Mills HS 1400 1400 1400 1400 1141 81.5 1187 84.8 1225 87.5 1302 93.0 1354 96.7 1353 96.6 1345 96.1 1336 95.4 1315 93.9 1303 93.1 1298 92.7 Columbia - West Wilde Lake HS 1424 1424 1424 1424 1371 96.3 1389 97.5 1420 99.7 1418 99.6 1442 101.3 1474 103.5 1494 104.9 1520 106.7 1543 108.4 1597 112.1 1621 113.8 Northeastern Howard HS 1420 1420 1420 1420 1943 136.8 2018 142.1 2043 143.9 2034 143.2 2057 144.9 2059 145.0 2049 144.3 2060 145.1 2069 145.7 2071 145.8 2043 143.9 Long Reach HS 1488 1488 1488 1488 1776 119.4 1833 123.2 1896 127.4 1981 133.1 2079 139.7 2166 145.6 2230 149.9 2291 154.0 2396 161.0 2527 169.8 2672 179.6 New HS #13

NS

Region HS Totals 2908 2908 2908 2908 3719 127.9 3851 132.4 3939 135.5 4015 138.1 4136 142.2 4225 93.4 4279 94.6 4351 96.2 4465 98.7 4598 101.7 4715 104.2 Northern Centennial HS 1360 1360 1360 1360 1672 122.9 1750 128.7 1792 131.8 1811 133.2 1850 136.0 1879 138.2 1891 139.0 1896 139.4 1916 140.9 1937 142.4 1963 144.3 Marriotts Ridge HS 1615 1615 1615 1615 1340 83.0 1386 85.8 1414 87.6 1446 89.5 1502 93.0 1518 94.0 1558 96.5 1602 99.2 1604 99.3 1655 102.5 1670 103.4 Mt Hebron HS 1400 1400 1400 1400 1594 113.9 1623 115.9 1648 117.7 1678 119.9 1709 122.1 1720 122.9 1756 125.4 1815 129.6 1812 129.4 1820 130.0 1822 130.1 Region HS Totals 4375 4375 4375 4375 4606 105.3 4759 108.8 4854 110.9 4935 112.8 5061 115.7 5117 117.0 5205 119.0 5313 121.4 5332 121.9 5412 123.7 5455 124.7 Southeastern Hammond HS 1220 1220 1220 1220 1347 110.4 1373 112.5 1348 110.5 1392 114.1 1423 116.6 1444 118.4 1515 124.2 1534 125.7 1575 129.1 1635 134.0 1715 140.6 Western Atholton HS 1460 1460 1460 1460 1526 104.5 1526 104.5 1559 106.8 1569 107.5 1588 108.8 1650 113.0 1651 113.1 1688 115.6 1704 116.7 1730 118.5 1801 123.4 Glenelg HS 1420 1420 1420 1420 1188 83.7 1169 82.3 1151 81.1 1177 82.9 1155 81.3 1169 82.3 1167 82.2 1141 80.4 1122 79.0 1122 79.0 1108 78.0 Reservoir HS 1551 1551 1551 1551 1589 102.5 1635 105.4 1707 110.1 1758 113.3 1797 115.9 1821 117.4 1832 118.1 1852 119.4 1858 119.8 1873 120.8 1927 124.2 River Hill HS 1488 1488 1488 1488 1202 80.8 1179 79.2 1182 79.4 1170 78.6 1158 77.8 1176 79.0 1145 76.9 1126 75.7 1118 75.1 1108 74.5 1126 75.7 Region HS Totals 5919 5919 5919 5919 5505 93.0 5509 93.1 5599 94.6 5674 95.9 5698 96.3 5816 98.3 5795 97.9 5807 98.1 5802 98.0 5833 98.5 5962 100.7 Countywide Totals 17246 17246 17246 17246 17689 102.6 18068 104.8 18385 106.6 18736 108.6 19114 110.8 19429 103.0 19633 104.1 19861 105.3 20032 106.2 20378 108.0 20766 110.1 'NS' New School proposed in FY 2018 Capital Budget

Capacity Utilization Rates with Board of Education's Approved FY 2018 Capital Budget Projects - Not Test for APFO

2028-29

HIGH SCHOOLS - Data for Demonstrative Purposes Only

Capacity 2018-19 2019-20 2020-21 2021-22 2022-23 2023-24 2024-25 2025-26 2026-27 2027-28

10/2/2017

46

slide-50
SLIDE 50

Post-Measures Aggregate Plan Columbia - East 2018 2019 2020 2021 Proj % Util. Proj % Util. Proj % Util. Proj % Util. Proj % Util. Proj % Util. Proj % Util. Proj % Util. Proj % Util. Proj % Util. Proj % Util. Oakland Mills HS 1400 1400 1400 1400 1141 81.5 1187 84.8 1225 87.5 1302 93.0 1354 96.7 1353 96.6 1345 96.1 1336 95.4 1315 93.9 1303 93.1 1298 92.7 Columbia - West Wilde Lake HS 1424 1424 1424 1424 1371 96.3 1389 97.5 1420 99.7 1418 99.6 1442 101.3 1474 103.5 1494 104.9 1520 106.7 1543 108.4 1597 112.1 1621 113.8 Northeastern Howard HS 1420 1420 1420 1420 1943 136.8 2018 142.1 2043 143.9 2034 143.2 2057 144.9 2059 145.0 2049 144.3 2060 145.1 2069 145.7 2071 145.8 2043 143.9 Long Reach HS 1488 1488 1488 1488 1776 119.4 1833 123.2 1896 127.4 1981 133.1 2079 139.7 2166 145.6 2230 149.9 2291 154.0 2396 161.0 2527 169.8 2672 179.6 New HS #13

NS

Region HS Totals 2908 2908 2908 2908 3719 127.9 3851 132.4 3939 135.5 4015 138.1 4136 142.2 4225 145.3 4279 94.6 4351 96.2 4465 98.7 4598 101.7 4715 104.2 Northern Centennial HS 1360 1360 1360 1360 1672 122.9 1750 128.7 1792 131.8 1811 133.2 1850 136.0 1879 138.2 1891 139.0 1896 139.4 1916 140.9 1937 142.4 1963 144.3 Marriotts Ridge HS 1615 1615 1615 1615 1340 83.0 1386 85.8 1414 87.6 1446 89.5 1502 93.0 1518 94.0 1558 96.5 1602 99.2 1604 99.3 1655 102.5 1670 103.4 Mt Hebron HS 1400 1400 1400 1400 1594 113.9 1623 115.9 1648 117.7 1678 119.9 1709 122.1 1720 122.9 1756 125.4 1815 129.6 1812 129.4 1820 130.0 1822 130.1 Region HS Totals 4375 4375 4375 4375 4606 105.3 4759 108.8 4854 110.9 4935 112.8 5061 115.7 5117 117.0 5205 119.0 5313 121.4 5332 121.9 5412 123.7 5455 124.7 Southeastern Hammond HS 1220 1220 1220 1220 1347 110.4 1373 112.5 1348 110.5 1392 114.1 1423 116.6 1444 118.4 1515 124.2 1534 125.7 1575 129.1 1635 134.0 1715 140.6 Western Atholton HS 1460 1460 1460 1460 1526 104.5 1526 104.5 1559 106.8 1569 107.5 1588 108.8 1650 113.0 1651 113.1 1688 115.6 1704 116.7 1730 118.5 1801 123.4 Glenelg HS 1420 1420 1420 1420 1188 83.7 1169 82.3 1151 81.1 1177 82.9 1155 81.3 1169 82.3 1167 82.2 1141 80.4 1122 79.0 1122 79.0 1108 78.0 Reservoir HS 1551 1551 1551 1551 1589 102.5 1635 105.4 1707 110.1 1758 113.3 1797 115.9 1821 117.4 1832 118.1 1852 119.4 1858 119.8 1873 120.8 1927 124.2 River Hill HS 1488 1488 1488 1488 1202 80.8 1179 79.2 1182 79.4 1170 78.6 1158 77.8 1176 79.0 1145 76.9 1126 75.7 1118 75.1 1108 74.5 1126 75.7 Region HS Totals 5919 5919 5919 5919 5505 93.0 5509 93.1 5599 94.6 5674 95.9 5698 96.3 5816 98.3 5795 97.9 5807 98.1 5802 98.0 5833 98.5 5962 100.7 Countywide Totals 17246 17246 17246 17246 17689 102.6 18068 104.8 18385 106.6 18736 108.6 19114 110.8 19429 112.7 19633 104.1 19861 105.3 20032 106.2 20378 108.0 20766 110.1

Capacity Utilization Rates with Proposed FY 2019 Capital Budget Projects - Not Test for APFO HIGH SCHOOLS - Data for Demonstrative Purposes Only

Capacity 2018-19 2019-20 2020-21 2021-22 2022-23 2023-24 Chart reflects May 2017 Projections, potential FY 2019 requested capacities and estimated redistricting. 2028-29 2024-25 2025-26 2026-27 2027-28 'NS' New School proposed in FY 2019 Capital Budget

47