related to body size indicating that bottom up forcing
play

related to body size, indicating that bottom-up forcing mechanisms - PDF document

Linking phytoplankton phenology to pink salmon productivity along a north-south gradient Michael J. Malick 1 , Sean P. Cox 1 , Franz J. Mueter 2 , and Randall M. Peterman 1 1 School of Resource and Environmental Management, Simon Fraser University,


  1. Linking phytoplankton phenology to pink salmon productivity along a north-south gradient Michael J. Malick 1 , Sean P. Cox 1 , Franz J. Mueter 2 , and Randall M. Peterman 1 1 School of Resource and Environmental Management, Simon Fraser University, Burnaby, British Columbia, Canada 2 School of Fisheries and Ocean Sciences, University of Alaska Fairbanks, Juneau, Alaska, USA
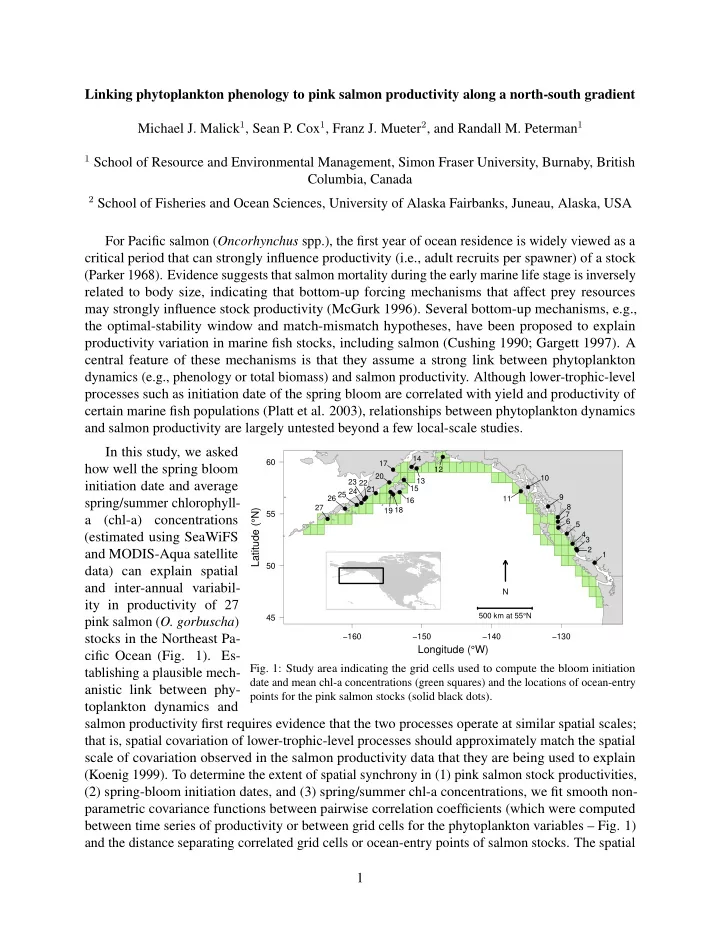
 For Pacific salmon ( Oncorhynchus spp.), the first year of ocean residence is widely viewed as a critical period that can strongly influence productivity (i.e., adult recruits per spawner) of a stock (Parker 1968). Evidence suggests that salmon mortality during the early marine life stage is inversely related to body size, indicating that bottom-up forcing mechanisms that affect prey resources may strongly influence stock productivity (McGurk 1996). Several bottom-up mechanisms, e.g., the optimal-stability window and match-mismatch hypotheses, have been proposed to explain productivity variation in marine fish stocks, including salmon (Cushing 1990; Gargett 1997). A central feature of these mechanisms is that they assume a strong link between phytoplankton dynamics (e.g., phenology or total biomass) and salmon productivity. Although lower-trophic-level processes such as initiation date of the spring bloom are correlated with yield and productivity of certain marine fish populations (Platt et al. 2003), relationships between phytoplankton dynamics and salmon productivity are largely untested beyond a few local-scale studies. In this study, we asked ● 14 60 17 how well the spring bloom ● ● 12 ● 20 10 ● 23 13 22 ● initiation date and average ● ● 15 21 24 ● ● ● 25 ● 9 26 ● 11 spring/summer chlorophyll- ● 16 ● ● 27 ● 8 ● 18 Latitude ( ° N) 19 55 7 a (chl-a) concentrations ● ● 6 ● 5 ● (estimated using SeaWiFS ● 4 3 ● ● 2 ● and MODIS-Aqua satellite 1 ● 50 data) can explain spatial and inter-annual variabil- N ity in productivity of 27 500 km at 55 ° N 45 pink salmon ( O. gorbuscha ) stocks in the Northeast Pa- −160 −150 −140 −130 Longitude ( ° W) cific Ocean (Fig. 1). Es- Fig. 1: Study area indicating the grid cells used to compute the bloom initiation tablishing a plausible mech- date and mean chl-a concentrations (green squares) and the locations of ocean-entry anistic link between phy- points for the pink salmon stocks (solid black dots). toplankton dynamics and salmon productivity first requires evidence that the two processes operate at similar spatial scales; that is, spatial covariation of lower-trophic-level processes should approximately match the spatial scale of covariation observed in the salmon productivity data that they are being used to explain (Koenig 1999). To determine the extent of spatial synchrony in (1) pink salmon stock productivities, (2) spring-bloom initiation dates, and (3) spring/summer chl-a concentrations, we fit smooth non- parametric covariance functions between pairwise correlation coefficients (which were computed between time series of productivity or between grid cells for the phytoplankton variables – Fig. 1) and the distance separating correlated grid cells or ocean-entry points of salmon stocks. The spatial 1

Download Presentation
Download Policy: The content available on the website is offered to you 'AS IS' for your personal information and use only. It cannot be commercialized, licensed, or distributed on other websites without prior consent from the author. To download a presentation, simply click this link. If you encounter any difficulties during the download process, it's possible that the publisher has removed the file from their server.

Recommend


More recommend