
SLIDE 1
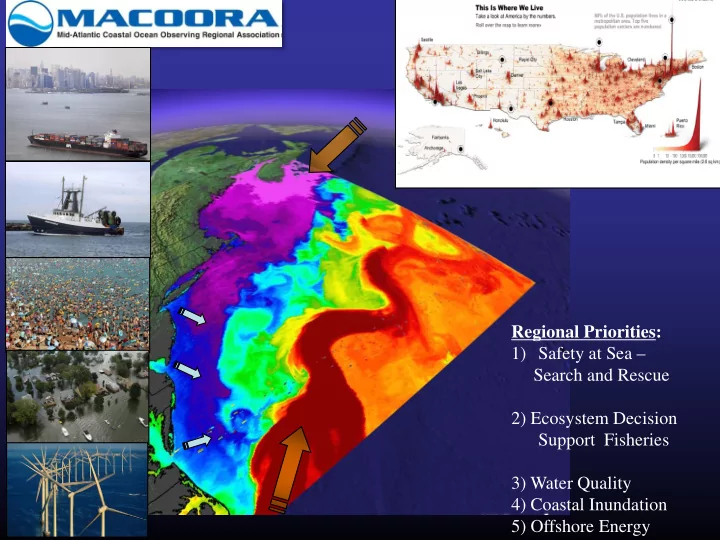
Regional Priorities: 1) Safety at Sea – Search and Rescue 2) Ecosystem Decision Support Fisheries 3) Water Quality 4) Coastal Inundation 5) Offshore Energy
Regional Priorities: 1) Safety at Sea Search and Rescue 2) - - PowerPoint PPT Presentation
Regional Priorities: 1) Safety at Sea Search and Rescue 2) Ecosystem Decision Support Fisheries 3) Water Quality 4) Coastal Inundation 5) Offshore Energy MARCOOS The Mid-Atlantic Regional Coastal Ocean Observing System 30 Co-PIs, 20
Regional Priorities: 1) Safety at Sea – Search and Rescue 2) Ecosystem Decision Support Fisheries 3) Water Quality 4) Coastal Inundation 5) Offshore Energy
Investigator Affiliation Investigator Affiliation
U.S. Coast Guard
Old Dominion University
Stevens Institute of Technology
University of Maryland
University of Massachusetts
Stevens Institute of Technology
University of Delaware
NOAA Mount Holly WFO A.Gangopadhy ay University of Massachusetts
Stevens Institute of Technology
OPeNDAP
Applied Science Associates
University of Maryland
Rutgers University
University of Delaware A.MacDonald Monmouth University
Rutgers University
NASA Wallops
University of Connecticut
Rutgers University
Rutgers University
University of North Carolina
WeatherFlow Inc.
University of Rhode Island
Rutgers University
SUNY, Stony Brook
Public Service Electric & Gas
CIT
NY/NJ COAST
Rutgers University
NWS WFOs Std Radar Sites Mesonet Stations LR HF Radar Sites Glider AUV Tracks USCG SLDMB Tracks NDBC Offshore Platforms CODAR Daily Average Currents
HOPS
ROMS
Rutgers University
STPS
NYHOPS
Stevens Institute of Technology
MARCOOS Regional Theme 1: Maritime Safety, Search And Rescue
What can we measure without going to sea that fish “care” about? Our Approach: Develop statistical models based on bottom trawl survey and OOS data to predict species distribution based on
Stratification Bottom temp Surface salinity (residuals vs. depth)
Benthic
Depth (log-transformed) Slope (residuals vs. depth) Sediment grain size
Remote
SST 443 nm reflectance 551 nm reflectance (residuals vs. depth) Proximity to fronts Cross-shore velocity Variance in cross-shore velocity Divergence trend
CTD
Partial CCA
Important Environmental Variables
As Axis 1 Scores increase… ↓ Temperature ↓ Depth ↑ Grain Size ↑ 551 nm Reflectance Residuals ↓ Slope Residuals ↓ 443 nm Reflectance
Important Environmental Variables
As Axis 3 Scores increase… ↑ Stratification ↑ SST ↑ 443 nm Reflectance ↑ Variance in cross-shore velocity ↓ Surface Salinity Residuals ↓ Cross-shore velocity
Prey abundance IOOS remote Pelagic in situ Benthic
Pelagic Demersal
Intercorrelated
Adult habitat GAM-Autumn
*Autumn
30 d - October 8 d - October
MARCOOS Regional Theme 1: Maritime Safety, Search And Rescue
232 km 154 km
After HF Radar
123 km 100 km
HF Radar Surface Current Maps STPS Statistical Forecasts 100 Weatherflow Wind Stations Are now Operational inputs to the U.S. Coast Guard’s Search And Rescue Optimal Planning System (SAROPS)
Hourly Surface Current Maps
MARCOOS Regional Theme 1: Maritime Safety, Search And Rescue
Individual Site Data Data Aggregator Forecast Product Generation Product Aggregator Decision Tool
MARCOOS Totals HF Radar Radials ROMS (Rutgers) STPS, (UConn) HOPS (SMAST) NYHOPS (Stevens) EDS NOAA National Network SAROPS
Year 1 & 2 Year 3 Distribution: OPeNDAP/ THREDDS Data Format: NetCDF
MARCOOS Regional Theme 1: Maritime Safety, Search And Rescue
MARCOOS Regional Theme 1: Maritime Safety, Search And Rescue
MARCOOS Regional Theme 1: Maritime Safety, Search And Rescue
Coast Guard Drifter Deployments January 2006 - December 2007 HF Radar National Network
User Requirements : Begun at MACOORA inundation users workshop (Baltimore,
2006) with input from regional emergency managers and other inundation forecast users; has continued with economist-led meetings and surveys.
Observations
Real time meteorological (wind, pressure, temperature), water level, waves, currents, rainfall, stream gauge/flow at least hourly or better
Modeling and Analysis
System requires access to partner- run high-resolution (2-4 km) hourly, 36 hr. meteorological forecasts. These in turn drive multiple hydrodynamic / coastal inundation models with very high resolution coastal grids. Inundation outputs are converted to visualization layers for integration with maps or aerial/satellite photos for delivery to end users.
Data Management and Communications
System has been developed by Applied Science Associates, supported by NOAA Chesapeake Bay Office and MACOORA.
25 Northern Bay stations 17 Southern Bay stations 10 DE stations (SOAP Web service) 6 stations (XML-RPC Web Service) 11 real-time stations 25 near-time stations (Web page scraping) 7-10 stations (ASCII Download) 4 stations (NetCDF Download) 37 MD stations 67 VA stations + 20-30 from PA/DE/WV (XML Download) 21 MD stations 35 VA stations + 6-10 from PA/DE/WV (REST Web service) Chesapeake Bay Labs 2 stations (ASCII) VIMS CBL
CBOS
Automated Collection Scripts
SOS
PostgreSQL
CIPS
THREDDS
MDDN R Application s
Model Validation Time series graphing Interactive GIS Mapping Station RSS Feeds Data Portal Public API for Data Access
NDBC NWS USGS PORTS CBIBS
Automated Collection Scripts
NWS Regional WRF Downloadable on East Coast FTP site as NetCDF
Winds
Weatherflow Downloadable as GRIB and NetCDF VIMS ELCIRC HPL ROMS NOAA RFC
Precip Hydro Pull Pull Forcing
OBSERVATIONS MODELS
ncWMS Java SOS
Results
CIPS Partners Data Management Products IOOS Standards
Implementation Timeframe
Funded as IOOS project in FY 2008 with a three-year grant, ending in September
further hope of continued funding to move towards a geographically limited ‘pre-
CIPS developments incorporated into a larger scale operational inundation forecast system. Future Updates Primary limiting factors are: Lack of computational resources to run real-time high- resolution hydrodynamic forecast model; lack of high resolution bathy/topo data; mapping of high res bathy/topo daa to model grid; efficiency and speed of visualization process. Improvements on all these fronts would lead to better system performance.
Doug Wilson NOAA Chesapeake Bay Office
John Smith Water Trail Education & Outreach Chesapeake Bay Observing System (IOOS)
data, web, education, information resources – embracing IOOS concepts and standards.
buoy information is used in classrooms
Service’s Captain John Smith Chesapeake National Historic Trail; they convey local and historic references.
platforms collecting a broad suite of measurements
The Chesapeake Bay Interpretive Buoy System (CBIBS) is a system to collect, transmit and interpret real-time environmental data from the Chesapeake Bay to a wide variety of constituents – including scientists,
and to fill critical observational gaps in the Chesapeake Bay.
Groups engaged in marine activities, with a special mission to support the National Park Service’s Captain John Smith Chesapeake National Historic Trail. Present buoys are located at historically significant locations along the Trail, and the System supports educational and informational tools to interpret the Captain John Smith Chesapeake National Historic Trail.
CBIBS employs integrated ocean observing system methods and technology to meet the needs of Chesapeake Bay users. CBIBS is a component of the U.S. Integrated Ocean Observing System, supported by the NOAA Chesapeake Bay Office (NCBO) and Chesapeake Bay Observing System (CBOS) partners. CBIBS provides an unparalleled opportunity to demonstrate the broad utility and versatility of observing systems. CBIBS has been designated a significant component
System being proposed in response to the recent Chesapeake Bay Executive Order.
Environmental and natural resource planners and decision makers, and the scientists, analysts, and applications developers who support them.
Education and Outreach interests. Recognizing that efficient use of environmental information requires an environmentally literate audience, a major focus of CBIBS is developing educational and interpretive context for the information provided by the observing
educators and their students, and environmental, historical, geographical, and cultural interpreters and their interest base.
The primary web site for CBIBS is WWW.BUOYBAY.ORG
Explore Buoy Data and Access Data and Metadata These pages serve the needs of the traditional
They include a Google Maps-based buoy locator page; a page displaying all the most recent data readings; a comprehensive graphing tool (including property- property plots) to visualize data time series; and a page to download single sensor or integrated data sets.
Visit the Buoys These pages provide access to real time data for those on the water or considering a trip, and also deliver historical, geographical, and environmental information tied to the buoy locations. In addition to basic data products, there is an option for data delivery via mobile device, and access to informational audio tracks. These tracks, as well as audio access to data, are also available via the 877- BUOYBAY phone service.
Buoys in the Classroom
This section contains both INVESTIGATIONS and CURRICULUM sections. Investigations are modules that explain environmental concepts to the user using real-time data; presently there are modules explaining temperature and turbidity. The curriculum sections have extensive modules – ESTUARIES 101 and CHESAPEAKE 102 – developed by teachers and education professionals to utilize real- time data in classrooms. The NOAA Chesapeake Bay Office offers teacher training in the use of these modules, as well as grants through the B-WET program to develop other teaching applications.
an SQL data base.
‘middleware’.
& stores data.
internal access to the data.
access to external data sources, and a Client Data Request Handler. Requests include browser based or designated users (e.g., the Verizon voice IVR, NWS, CBOS, applications, kiosks) via an API key.
erroneous sensors, or deviations from a geographic location (‘anchor watch’).
widgets, or any XML requests.
look of the buoy an featuring an audio and touchscreen interface - has been implemented on shore in view of the Nauticus buoy on the Elizabeth River in Norfolk, VA.
CBIBS: Demonstrating the Broad Potential of IOOS
technologies - working on Nitrate, GPS water level, Phosphate, other; Next phase is smaller tributary buoys with equivalent capacity.
web, mobile devices) to deliver data, and the educational curricula that are being built around them, demonstrate an underemphasized aspect
diverse user base is a critical asset to maintaining long term sustainability and funding for a system.
State and Local, Private (Nauticus, Dominion Power/MARI)
CBIBS: Demonstrating the Broad Potential of IOOS