Regional Integration in the CIS-countries: suggestions from the - - PDF document

regional integration in the cis countries suggestions
SMART_READER_LITE
LIVE PREVIEW

Regional Integration in the CIS-countries: suggestions from the - - PDF document

Regional Integration in the CIS-countries: suggestions from the experience of South America. 1 By Domingo Cavallo and Mariano Giachetti The purpose of this presentation is to use the experience of the economies of South America on how to


slide-1
SLIDE 1

Regional Integration in the CIS-countries: suggestions from the experience of South America.

By Domingo Cavallo and Mariano Giachetti

1

The purpose of this presentation is to use the experience of the economies of South America on how to determine the acceptable level of concurrency in the process of regional integration without prejudice to the national interests of the CIS-countries, a question that was posed by the organizers of the conference.

CIS countries and South America: a comparison

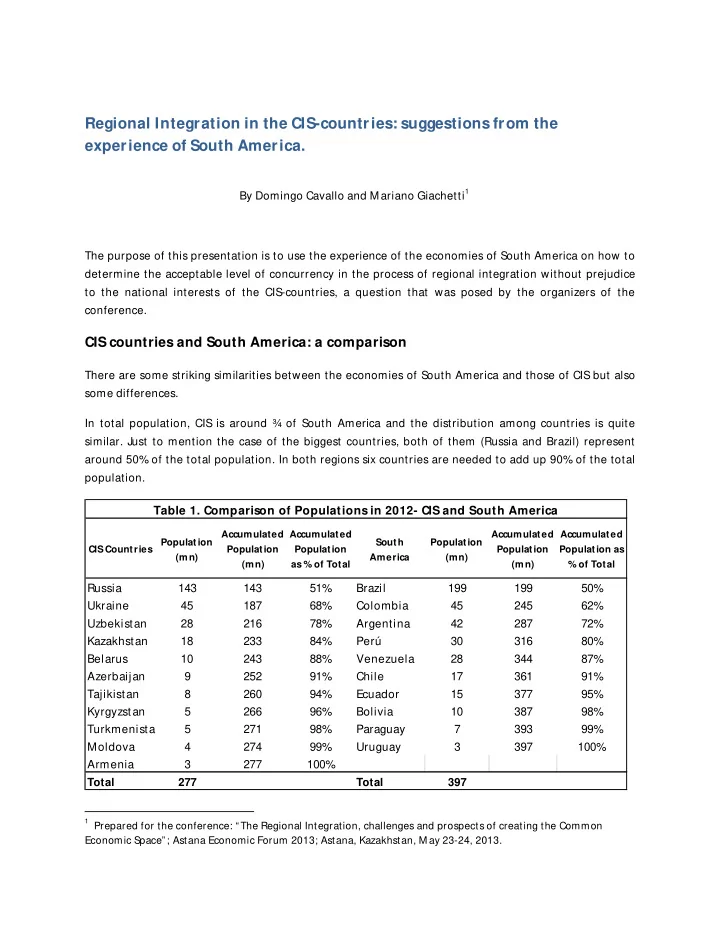
There are some striking similarities between the economies of South America and those of CIS but also some differences. In total population, CIS is around ¾ of South America and the distribution among countries is quite

  • similar. Just to mention the case of the biggest countries, both of them (Russia and Brazil) represent

around 50% of the total population. In both regions six countries are needed to add up 90% of the total population.

1 Prepared for the conference: “ The Regional Integration, challenges and prospects of creating the Common

Economic Space” ; Astana Economic Forum 2013; Astana, Kazakhstan, M ay 23-24, 2013. CIS Countries Population (mn) Accumulated Population (mn) Accumulated Population as % of Total South America Population (mn) Accumulated Population (mn) Accumulated Population as % of Total

Russia 143 143 51% Brazil 199 199 50% Ukraine 45 187 68% Colombia 45 245 62% Uzbekistan 28 216 78% Argentina 42 287 72% Kazakhstan 18 233 84% Perú 30 316 80% Belarus 10 243 88% Venezuela 28 344 87% Azerbaijan 9 252 91% Chile 17 361 91% Tajikistan 8 260 94% Ecuador 15 377 95% Kyrgyzstan 5 266 96% Bolivia 10 387 98% Turkmenistan 5 271 98% Paraguay 7 393 99% Moldova 4 274 99% Uruguay 3 397 100% Armenia 3 277 100% Total 277 Total 397 Table 1. Comparison of Populations in 2012- CIS and South America

slide-2
SLIDE 2

In total GDP measured at current dollars, CIS economies represent more than 3/ 5 of South America, but the distribution among countries is much more concentrated in the leading economies in CIS . While Brazil represents 57% of the total GDP of South America, Russia represents 76 % of the total GDP of CIS. In South America five countries are needed (Brazil, Argentina, Colombia, Venezuela and Chile) to accumulate 90% of the GDP of the region, while in the case of CIS are needed three countries (Russia, Kazakhstan and Ukraine) to add up 90% of the GDP of the region. The dispersion of Gross National Income per capita is higher in CIS than in South America, and while in CIS the biggest economy (Russia) has the highest GNI per capita, in the case of South America the biggest economy (Brazil) has just the average GNI for the region. The growth performance of CIS countries was clearly superior to that of the South American economies, but this may simply reflect the recovery of the CIS economies after the deep recessions that affected the region after the dissolution of the URSS.

CIS countries GDP Current Prices, US dollars (bn) GDP Accumulat ed GDP Accumulat ed as % of Total South America GDP Current Prices, US dollars (bn) GDP Accumulated GDP Accumulated as % of Total

Russia 1,954 1,954 76% Brazil 2,425 2,425 57% Kazakhstan 201 2,154 83% Argentina 475 2,900 68% Ukraine 180 2,334 90% Colombia 365 3,265 77% Azerbaijan 71 2,405 93% Venezuela 338 3,603 85% Belarus 58 2,464 95% Chile 268 3,872 91% Uzbekistan 52 2,515 97% Peru 200 4,072 96% Turkmenistan 33 2,549 99% Ecuador 71 4,143 98% Armenia 11 2,559 99% Uruguay 50 4,192 99% Moldova 8 2,567 99% Bolivia 27 4,219 99% Tajikistan 7 2,574 100% Paraguay 26 4,245 100% Kyrgyzstan 6 2,580 100% Total 2,580 Total 4,245 Table 2. Comparison of GDP in 2012 -CIS and South America

slide-3
SLIDE 3

Graph 1: Gross National Income per capita in 2012 Graph 2: GDP Performance; Average growth 1995/ 2012

2 4 6 8 10 12 14 16 Russia Belarus Kazakhstan Azerbaijan Turkmenistan Ukraine Armenia M oldova Uzbekistan Tajikistan Kyrgyzstan Thousands Constant USD 2005 PPP

CIS

2 4 6 8 10 12 14 16 Argentina Chile Uruguay Venezuela Brazil Perú Colombia Ecuador Paraguay Bolivia Thosunads Constant USD 2005 PPP

South America

0% 2% 4% 6% 8% 10% 12% Azerbaijan Turkmenistan Belarus Armenia Tajikistan Kazakhstan Uzbekistan Kyrgyzstan Russia M oldova Ukraine

CIS

0% 2% 4% 6% 8% 10% 12% Peru Chile Bolivia Ecuador Colombia Argentina Brazil Uruguay Venezuela Paraguay

South America

slide-4
SLIDE 4

Suggestions to CIS countries from the experience of South America

From our experience in South America, we will emphasize two aspects to be considered in order to reassure that the process of integration does not prejudice the national interest of CIS countries: 1) Bilateral or multilateral free trade agreements among the CIS countries offer more freedom to individual nations to choose the best commercial external policy than a Custom Union; 2) Monetary integration should proceed only after participant nations demonstrate clear commitment to fiscal responsibility and willingness to accept fiscal transfers to prevent financial crisis. Free Trade Area versus Custom Union The experience of South America suggests that for most individual nations it is preferable to participate in a Free Trade Area rather than in a Custom Union. Members of a Custom Union cannot individually negotiate Free Trade agreements with non-members

  • nations. For example, in Latin America, Uruguay and Paraguay could not negotiate free trade

agreements with the United States and the European Union like those that Chile, Peru and Colombia did negotiate, simply because Brazil during the 90’s and Argentina during the last ten years were not interested in free trade with those two important economies. This restriction that the Custom Union imposed on Uruguay and Paraguay was costly not only for those two economies, but also for Brazil and Argentina. Two support this opinion I have suggested to a student of mine at Yale University

2 to compare the trade

performance of two group of Latin American countries between 1990 and 2011, a period in which all of them tried to encourage foreign trade through trade negotiations. One group includes the four MERCOSUR countries (Argentina, Brazil, Paraguay and Uruguay). The other Group includes Chile, Colombia, México, Panamá and Perú (which in the tables is denominated “FTA”). The table shows the performance of Exports, Imports and Total Trade in the two groups of countries:

Table 3. Annual percentage change during the period 1990-2011

EXPORTS MERCOSUR FTA Intra-regional 13.4% 14.4%

2 See M elina Sánchez M ontañes’ paper entitled :” MERCOSUR and the choice between a free trade area and a

Custom Union” , which you can request by e-mail to melina.snchez@yale.edu

slide-5
SLIDE 5

With the rest of the world 10.4% 13.4% Total 10.6% 13.5% IM PORTS MERCOSUR FTA Intra-regional 13.4% 14.8% With the rest of the world 12.6% 12.6% Total 12.6% 12.8% TOTAL TRADE MERCOSUR FTA Intra-regional 13.4% 14.4% With the rest of the world 11.0% 13.0% Total 11.5% 13.1% Exports increased significantly more in FTA countries rather than in MERCOSUR. This happened not only with Exports to the rest of the world but also with intraregional exports. Imports increased slightly more in FTA countries, particularly intraregional imports. As a consequence, Total Trade performance was clearly better for the FTA countries than for the MERCOSUR countries, both intraregional and with the rest of the world. In terms of GDP growth, the performance of the FTA countries of South America (Chile, Perú and Colombia) was clearly superior to the performance of Argentina, Brazil, Paraguay and Uruguay. Look at the panel on the right hand side of graph 2. In the case of CIS countries, if they become members of a Custom Union with Russia, they may encounter restrictions to negotiate free trade agreements with other countries that may become very desirable commercial partners like the Eastern European economies, the European Union, China and the

  • US. In comparison with South America, the risk of conflicting national interests among the nations of the

region is greater because of the higher proportion that Russia represent of the regional GDP and the higher per-capita GDP that Russia has compared with Brazil. In other words, Russia may have more power and more contrasting national interest to prevent negotiation of its partners in a Custom Union that the power and contrasting interest Brazil had in relation to its partners in MERCOSUR.

slide-6
SLIDE 6

Order and speed of monetary and financial integration The recent experience of the European Union suggests that it is dangerous to proceed with monetary integration while fiscal policies, deposit insurance schemes, bank regulation and supervision and bank resolution procedures continue to be national and uncoordinated. The experience of South America supports this conclusion even though the cases of monetary integration were very short lived and de facto. The closest resemblance of a monetary integration process was that of Brazil and Argentina between 1994 and 1998. Argentina had adopted the Convertibility Plan in 1991 and had its currency strongly pegged to the US Dollar. Brazil applied a similar strategy to eliminate hyperinflation when it implemented Plan Real in 1994. Both currencies, The Peso and the Real were pegged to the US Dollar and policy makers in the countries of MERCOS UR were convinced that this was an effective way of coordinating macro-economic policies, a commitment of the participant countries in the Treaty that created MERCOSUR. The lack of sufficient fiscal responsibility, particularly of the state and provincial governments, in both Brazil and Argentina, precipitated financial crisis in 1999 (Brazil) and 2001 (Argentina) that were managed in uncoordinated ways and generated very large episodes of cross-exchange rate instability and complete monetary disintegration. A comparison of the performance of the bilateral relations of Brazil and Argentina, on one side, and Russia and Kazakhstan, on the other side, shows that the CIS nations, at least the two considered in this comparison are better prepared for a process of monetary and financial integration than Brazil and Argentina.

Comparing the economic performance of Argentina-Brazil and Russia- Kazakhstan The following graphs show, on the left hand side, the performance recorded in the economies

  • f Argentina and Brazil during the period 1995/ 2012.On the right hand side the graphs show

the performance of Russia and Kazakhstan in the same period of time. Exchange Rates

slide-7
SLIDE 7

Exchange rates behaved quite differently in Argentina and Brazil. While in Argentina during the period 1995/ 2001 the exchange rate did not change, in Brazil there were significant currency devaluations (measured as the % increase in the local currency price of the US Dollar), especially in the years 1995 and 1999 . Argentina registered a huge devaluation of 215 % y/ y in

  • 2002. In Argentina there was a small nominal appreciation in 2003 and the exchange rate was

rather stable until 2008 while in Brazil the Real appreciated in nominal terms. Both countries’ currencies experienced devaluations in 2009. After that year the Argentinean Peso continued devaluing and the Brazilian Real appreciated again in 2010 and 2011 to suffer devaluation in 2012. Regarding the exchange rate in Russia and Kazakhstan, the pattern is rather similar in both

  • countries. Even though Russia recorded greater volatility than Kazakhstan, especially in the

period 1995-1999, since 2000 the currencies of the two countries registered quite similar behavior

  • 20%
  • 10%

0% 10% 20% 30% 40% 50% 60% 70% 80% 1995 1996 1997 1998 1999 2000 2001 2002 2003 2004 2005 2006 2007 2008 2009 2010 2011 2012

Graph 3: Exchange Rates: % change in the local currency price of the US Dollar: Argentina and Brazil

Argentina Brazil

slide-8
SLIDE 8

Inflation Rates During the years 1995/ 2001 inflation in Brazil was substantially higher than in Argentina. In Argentina inflation rates were close to zero, while Brazil recorded higher inflation. Argentina recorded a sharp jump in the price level in 2002 as a result of the strong devaluation of that

  • year. Over the next two years, the inflation rate went down in both countries. After that year,

while in Brazil inflation continued down, in Argentina it jumped up to 23% y/ y in 2008 and remained around that level until now..

  • 20%
  • 10%

0% 10% 20% 30% 40% 50% 60% 70% 80% 1995 1996 1997 1998 1999 2000 2001 2002 2003 2004 2005 2006 2007 2008 2009 2010 2011 2012

Graph 4: Exchange Rates: % change in the local currency price of the US Dollar: Kazakhstan and Russia

Kazakhstan Russia

slide-9
SLIDE 9

During most of the period the inflation rate was higher in Russia than in Kazakhstan, especially until 2001, when the inflation gap started to shrink. But in spite of these differences, inflation moved in the same direction in both countries and converged to similar rates.

  • 10%

0% 10% 20% 30% 40% 50% 60% 70% 80% 90% 1995 1996 1997 1998 1999 2000 2001 2002 2003 2004 2005 2006 2007 2008 2009 2010 2011 2012

Graph 5:Annual rate of Inflation: Argentina and Brazil

Argentina Brazil

slide-10
SLIDE 10

GDP Performance During the period 1995-2012, GDP growth was quite different in Argentina and Brazil. The growth rate of GDP was clearly more volatile in Argentina than in Brazil.

  • 10%

0% 10% 20% 30% 40% 50% 60% 70% 80% 90% 1995 1996 1997 1998 1999 2000 2001 2002 2003 2004 2005 2006 2007 2008 2009 2010 2011 2012

Graph 6: Annual rate of Inflation: Kazakhstan and Russia

Kazakhstan Russia

slide-11
SLIDE 11

Regarding the evolution of GDP in Russia and Kazakhstan their cycles are quite similar. During the period 1995-1998 volatility was high in both countries.. Beginning in 1999 until 2008 both enjoyed positive economic growth. However, during most of the period Kazakhstan recorded a higher GDP growth than Russia.

  • 12.5
  • 10.0
  • 7.5
  • 5.0
  • 2.5

0.0 2.5 5.0 7.5 10.0 12.5 15.0 1995 1996 1997 1998 1999 2000 2001 2002 2003 2004 2005 2006 2007 2008 2009 2010 2011 2012

Graph 7: Annual GDP Growth: Argentina and Brazil

Argentina Brazil

slide-12
SLIDE 12

Fiscal Balance Fiscal deficits prevailed all along the period 1996-2012 in Argentina and Brazil.. In the sub-period 1996-2000 the fiscal deficit in Brazil was much larger than in Argentina. That explain why the peg to the dollar implicit in Plan Real was abandoned in early 1999. Between 2001 and 2006 the fiscal deficit was much higher in Argentina than in Brazil, which in turn explains the difficulties to maintain the Convertibility Plan in 2001. In the last sub-period 2006-2012 fiscal results tended to improve in both countries, but the fact that Argentina had lost domestic and foreign credit and relied in money printing to finance the deficits, explains the much higher rate of inflation in Argentina compared with Brazil.

  • 12.5
  • 10.0
  • 7.5
  • 5.0
  • 2.5

0.0 2.5 5.0 7.5 10.0 12.5 15.0 1995 1996 1997 1998 1999 2000 2001 2002 2003 2004 2005 2006 2007 2008 2009 2010 2011 2012

Graph 8: Annual GDP Growth: Kazakhstan and Russia

Kazakhstan Russia

slide-13
SLIDE 13

With respect to the fiscal accounts Russia and Kazakhstan started from a situation of deep fiscal

  • vulnerability. During the period 1996/ 2000 the average annual deficit was around 5% of GDP in

both countries. However the fiscal situation changed radically in the following five years, when both countries reached important fiscal surpluses. During the period 2001/ 2006 annual fiscal results in Russia averaged 3.4% of GDP, while in Kazakhstan averaged 2.3%. In the following years the behavior somewhat diverged. While in the period 2007/ 2012 fiscal performance improved in Kazakhstan, achieving an average annual fiscal surplus of 2.7% of GDP, in Russia fiscal results worsened to 0.7% of GDP. Russia had a large deficit (6.3% of GDP) in the crisis of 2009, while Kazakhstan recorded only a deficit of 1.2% of GDP in that year.

  • 6
  • 5
  • 4
  • 3
  • 2
  • 1

1 2 3 4 1996/ 2000 2001/ 2006 2007/ 2012

Graph 9: Fiscal Result as % of GDP: Argentina and Brazil

Argentina Brazil

slide-14
SLIDE 14

Summary and conclusion In summary, over time there was a fairly high degree of synchronization of the economies in Russia and Kazakhstan. On the contrary, the degree of synchronization was rather poor in Brazil and Argentina and deteriorated over time. This difference explains why monetary integration is still in the agenda of CIS while it has disappeared from the agenda of M ERCOSUR. But this observation does not allow jumping to the conclusion that CIS countries are already prepared to enjoy the benefits of monetary and financial integration. Furthermore, the existing strong similarity in the behavior of the economies of Russia and Kazakhstan is likely to respond to the fact that both are strong energy producers and have benefited from the same type of external shocks, something that it is not necessary the case of the rest of the CIS countries.

  • 6
  • 5
  • 4
  • 3
  • 2
  • 1

1 2 3 4 1996/ 2000 2001/2006 2007/ 2012

Graph10: Fiscal Result as % of GDP: Kazakhstan and Russia

Kazakhstan Russia

slide-15
SLIDE 15
slide-16
SLIDE 16