Reducing Energy Consumption in Future Broadband Wireless Networks - - PDF document

reducing energy consumption in future broadband wireless
SMART_READER_LITE
LIVE PREVIEW

Reducing Energy Consumption in Future Broadband Wireless Networks - - PDF document

Reducing Energy Consumption in Future Broadband Wireless Networks through a Hierarchical Architecture Aizat Ramli 1 , David Grace 2 Department of Electronics, University of York York YO10 5DD, United Kingdom afr501@ohm.york.ac.uk


slide-1
SLIDE 1

Reducing Energy Consumption in Future Broadband Wireless Networks through a Hierarchical Architecture

Aizat Ramli 1, David Grace 2

Department of Electronics, University of York York YO10 5DD, United Kingdom

afr501@ohm.york.ac.uk dg@ohm.york.ac.uk Abstract— This paper investigates the benefits of applying a hierarchical architecture to future broadband networks, in terms

  • f energy efficiency and throughput. Energy efficiency is

investigated in terms of the energy consumption ratio (ECR) and the energy reduction gain (ERG) in different forms of dual hopped clustered networks. The results are compared to that of a traditional single hop with no hierarchical formation. It is shown that dual hop cluster networks can improve the overall energy consumption, but care needs to be taken to ensure that the backhaul links within the network do not become bottlenecks at high offered traffic levels. The paper shows that this issue can be alleviated by applying directional antennas at the hub base station, which results in a further decrease in the system’s energy consumption.

  • I. INTRODUCTION

The energy efficiency of wireless communications networks is attracting considerable interest, as their increasing data rates, and ever increasing use mean that they are consuming an ever increasing proportion of the world‟s energy usage. Today, the world is trying to reduce energy consumption, in order to ultimately reduce requirements for fossil fuels. Future wireless networks will carry not only user- to-user traffic, but also machine-to-machine data. Such machine-based traffic can include low rate data from sensors, such as periodic measurements, to high-data rate streaming video from the next generation of CCTV. User-based traffic is also seeing considerable increase, as users expect to receive the same applications on their laptops and tablets as they have in their desktops. Thus, the structure of next generation networks is likely to be more ad hoc in nature, able to cope with a wide range of traffic requirements, with the structure adapting load requirements and spatial usage. Wireless networks must take into account these data requirements, usage, cost and energy consumption. In the case of mobile devices, transmit power and the amount of processing are two important factors. Linked with this is the type of wireless communications architecture, both access and backhaul, that needs to be used with these next generation

  • architectures. For example the FP7 BuNGee project is

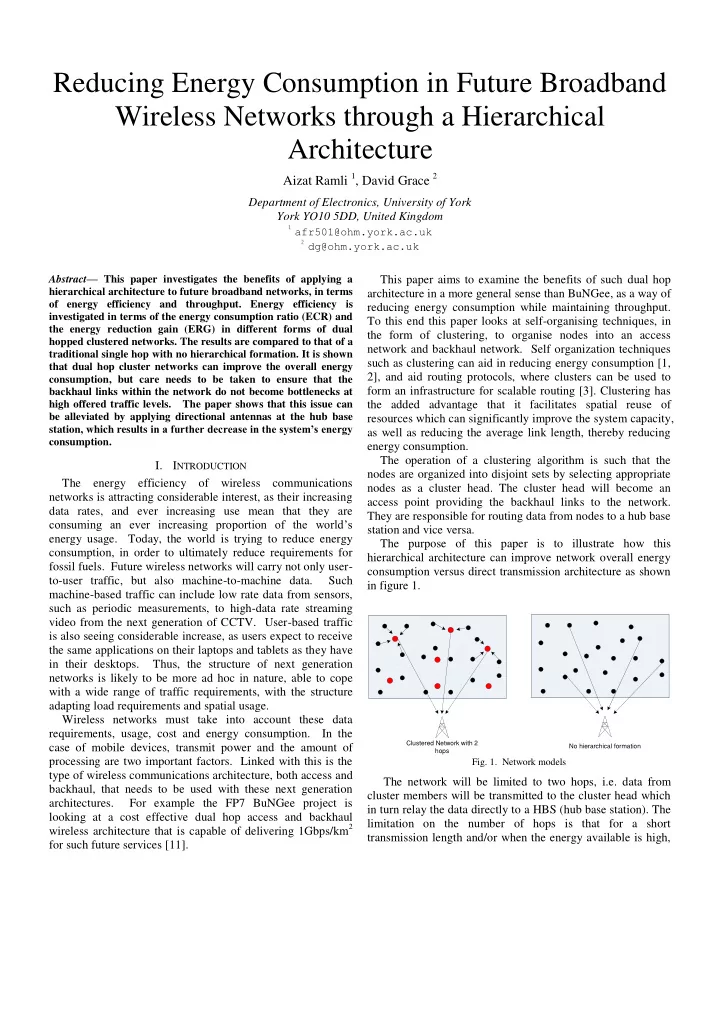
looking at a cost effective dual hop access and backhaul wireless architecture that is capable of delivering 1Gbps/km2 for such future services [11]. This paper aims to examine the benefits of such dual hop architecture in a more general sense than BuNGee, as a way of reducing energy consumption while maintaining throughput. To this end this paper looks at self-organising techniques, in the form of clustering, to organise nodes into an access network and backhaul network. Self organization techniques such as clustering can aid in reducing energy consumption [1, 2], and aid routing protocols, where clusters can be used to form an infrastructure for scalable routing [3]. Clustering has the added advantage that it facilitates spatial reuse of resources which can significantly improve the system capacity, as well as reducing the average link length, thereby reducing energy consumption. The operation of a clustering algorithm is such that the nodes are organized into disjoint sets by selecting appropriate nodes as a cluster head. The cluster head will become an access point providing the backhaul links to the network. They are responsible for routing data from nodes to a hub base station and vice versa. The purpose of this paper is to illustrate how this hierarchical architecture can improve network overall energy consumption versus direct transmission architecture as shown in figure 1.

Clustered Network with 2 hops No hierarchical formation

  • Fig. 1. Network models

The network will be limited to two hops, i.e. data from cluster members will be transmitted to the cluster head which in turn relay the data directly to a HBS (hub base station). The limitation on the number of hops is that for a short transmission length and/or when the energy available is high,

slide-2
SLIDE 2

a direct transmission is more energy-efficient than a multi-hop minimum-transmission-energy routing protocol [1]. This paper is organized as follows. Section II briefly presents the energy metric models that will be used to compare different architectures. In section III, we explain the various aspects of the network model and parameters. Simulation results are discussed in section IV. Finally, conclusions are drawn and further work will be discussed.

  • II. ENERGY EFFICIENCY METRICS

In order to meaningfully measure the percentage of energy reduction gain in a wireless system, one has to consider the impact on quality of service (QOS) brought about by using less power. The Energy Consumption Ratio (ECR) metric [4] takes into accounts not only the energy consumed but also

  • throughput. ECR defines the amount of energy delivered by
  • ne bit of information, and can be obtained by

E PT P ECR M M D   

(1) where E is the energy in Joules and P is Power in Watts required to deliver M bits over time T, and data D = M/T is the data rate or throughput. Energy Reduction gain (ECG) metric is used compare the energy efficiency between two different systems. Energy Reduction Gain is given by

1 2 1

ECR ECR ERG ECR  

(2) The metrics do not take into account the energy consumed in specific different modes, i.e. transmit/receive, sleep and idle

  • modes. Here we assume two modes transmit/receive and
  • sleep. We consider two situations, considered as best and

worst cases, where the sleep mode consumed no power and a situation where it consumes identical power to a node in transmit/receive mode In this paper we shall only consider uplink transmission as it was noted in [9] that the battery life is inversely proportional to the transmit power. Therefore to maximise the battery life (or total fixed amount of energy consumed in the case of externally powered nodes), each node has to reduce transmit power to a fixed level, which in some circumstances may result in a lower, but more energy efficient data rate per unit bandwidth.

  • III. SYSTEM MODEL

The system model in this paper needs to take into account a number of factors, including the approach to clustering, the propagation model and channel assignment scheme, along with how the received signal to interference plus noise ratio (SINR) is mapped to capacity. We also address the power control model used and the antenna gains of the antennas used with the backhaul segment. These are explained below.

  • A. Clustering

In our previous work [5] we have demonstrated how nodes can be made to learn about their environment through multiple sensing snapshots. The information gathered by each node is used to aid the node to determine whether to become a cluster head autonomously. The learning process undertaken by each node is consistent with the definition of cognitive radio [6]. In [6] a cognitive radio is defined as „a radio that is aware of and can sense its environment, learn from its environment and adjust its operation according to some objective function‟. The clustering algorithm as proposed in [5] provides an efficient coverage of other nodes in the network whilst still reducing significantly the transmission link length and cluster overlap. With reference to performance from [5] as shown in Fig 2, it can be seen that a network that is able to learn can make a better decision in choice of cluster head, in terms of mean reduced transmission distance, compared with one that will select a cluster head without learning. That is such networks are more likely to select node located in highly dense area to become the cluster head, thus reducing the transmission link length.

  • Fig. 2. Pthreshold vs average distance nearest cluster head

Reducing the transmission link length (and associated transmit power) significantly reduces energy dissipation assuming an energy dissipation model as proposed in [6] is directly proportional to the transmission distance. Forming clusters with fewer overlaps can yield a higher QOS as it reduces transmission collisions and channel contention thus allowing communication to become more efficient. We simulated the proposed algorithm in [5] with Priority factor P of 1, with 200 nodes randomly distributed on a square service area of 200m2 with the HBS (hub base station) in the centre of the service area. During the clustering process, the transmit powers of the nodes operate at a maximum power of

  • 10dBW.
  • B. Propagation Model and Channel Assignment Scheme

We focus our modelling on static or relatively slow changing wireless networks, with nodes that do not move significant distances during the measurement period. We also assume that nodes are located above roof top height so that the height of antenna has relatively small impact on the path loss. (In practice the relative performance of the approaches here are likely to be relatively insensitive to propagation.) The propagation model that we have used in this paper was developed by WINNER II (model B5a) [7] which was based

  • n statistical measurement results. The path loss (PL) in the

model chosen is described by (3), which is valid for distance

  • f d<8km and frequencies f in the range of 2-6 GHz.
slide-3
SLIDE 3

10 10

[ ] 23.5log ( [ ]) 42.5 20log 5.0 f GHz PL d m          (3)

The signal received by each node consists of a strong LOS signal and single bounce reflection [7]. The amount of power received Pr by each node at a particular channel can be calculated according to equation (4);

Pr

i i

Pt Gt Gr PL Noise      (4)

Where Pti is the power transmitted by node i on a particular channel, PLi is the estimated path loss as given by (3) and is dependent upon the link length. The node antenna patterns are assumed to be isotropic, with their transmit and receive gains, Gt = Gr = 0dBi. The operating frequency is in the 2.1 GHz band and the channel bandwidth is 1MHz. Nodes will have the access to the channels via Distributed Channel Assignment scheme (DCA) where the channels are assigned on a file by file basis. Each node is able to sense the interference level on a channel before accessing it. [12] The interferencethreshold is

  • 50dBm and only 3 channels are selected randomly and

allowed to be scanned at a time. To avoid channel contentions between cluster members and cluster heads, it is assumed that the spectrum pool is partitioned into two subsets containing equal number of channels. Table 1 provide a summary of the parameters used.

  • C. Linkage to System Mapping

We have adopted the truncated Shannon bound (TSB) [8] to map the signal to interference plus noise ratio (SINR) level to capacity. The TSB describes the relationship between SNIR and bandwidth efficiency of different modulation scheme. According to the TSB the, achievable channel capacity for user be obtained by (5)

2 max

0, log (1 ) C B SINR BC        

if SINRmin<SINR<SINRmax (5) Where is the attenuation factor, C is the channel capacity, SINRmin is the minimum SNIR at which a signal can still be successfully received by a receiver. Therefore SINRmin also serves as an SINRthreshold. The parameters of the TSB are SINRmin = 1.8 dB, SINRmax = 21 dB and Cmax = 4.5bps/Hz.

  • D. Uplink Power Control

Uplink power control enables individual nodes to increase

  • r decrease their transmit power to meet certain objectives

such as improve system capacity, increase coverage or to reduce power consumption. In LTE, uplink power control can be performed by the user simply based on signal strength measurements; such technique is called open loop power control [10]. A user will either reduce or increase its transmission power to achieve a certain Signal to Noise Ratio (SNR). We have employed the LTE

  • pen loop power control in our system with each user having

SNRtarget of 30dB. The value of SNRtarget was chosen to provide some margin for expected interference at the receiver, during the life time of the transmission (The TSB mapping

  • perates effectively in an SINR range of 1.8-21dB).
  • Table. 1. System Parameters

Parameters Value Size of Network layout 200m2 Number of Nodes 200 Cluster Radius 30m Centre Frequency 2.1 GHz Carrier Bandwidth 1MHz Maximum Transmit Power

  • 10dBW

Node Antenna Gain (Gt,Gr) 0dBi Noise figure 5 dB SINRthreshold 1.8 dB SNIRmax 21 dB Noise floor

  • 134dBW

interferencethreshold

  • 50dBm

Nodes antenna heights 25 m Cmax 4.5bps/Hz

  • E. Directional antennas

In a clustered network, the end-to-end throughput of the system can be constrained by the high relaying burden on the cluster head. It is important that the backhaul is dimensioned appropriately otherwise some transmissions which are successfully transmitted over the access network will be delayed due to the limited resources (channels) available at the cluster head. The level of resources can be improved by improving the spatial reuse. This can be achieved by applying a directional antenna at the HBS. We assume that the HBS can support several directional antennas whose main lobe is directed towards every cluster head. This approach has been adopted by the FP7 BuNGee project, with dual hop architecture, albeit with a set of nodes that are less ad hoc in

  • nature. The directional antenna at the HBS is based on [11]

whose radiation pattern is shown in Fig 3. We did not exploit the possible dual polarisations of such an architecture, but considered the co-polar gains only.

  • Fig. 3. Antenna radiation pattern designed by COBHAM [11]
  • IV. SIMULATION RESULTS

To study the energy efficiency, we must first understand how the system throughput varies with offered traffic. We adopted a file based traffic model, assuming a negative

slide-4
SLIDE 4

exponential interarrival time, with the file sizes being uniformly distributed. The end-to-end system throughput is a summation of the throughput all users within the system, taking into account constraints (bottlenecks) within both the access and backhaul segments. In the case of the single hop, the system throughput relates to just the throughput of the access network. The offered traffic is the traffic arising from both newly generated and retransmitted files in bits over a measurement interval. Fig 4 illustrates the system throughput for three different network models; the single hop model, the clustered network and the clustered network with a directional antenna applied to the HBS. Note that the channels available for the single hop model was 80 whilst the clustered networks were provided with only 40 channels which were partitioned into two equal subsets for cluster members and cluster heads. Fig 4 shows that the end-to-end throughput of the clustered network without any directional antennas tends to saturate after 100Mb/s offered traffic. The saturation is caused by mainly bottlenecks on the backhaul segment due to high traffic load and limited channel availability. This hypothesis can be validated as Fig 5 illustrates the total throughput of the data transmission on the access segment between the cluster members (users) to their corresponding cluster heads. The throughput between these cluster members and cluster head follows an almost a linear relationship to the offered traffic

  • Fig. 4. Comparison of different network scenario models end-to-end

throughput

  • Fig. 5. Throughput of cluster member to cluster head

When a directional antenna is employed at the HBS it increases the spatial reuse, thereby providing more resources, which in turn relieve the bottlenecks experienced by the backhaul segment. This results in an increase in the end-to- end throughput ensuring that the performance is almost identical to that of a single hop network with twice the number of channels. For a more thorough comparison we compare the bandwidth efficiency between the three network

  • scenarios. Here the bandwidth efficiency of a system is found

using (6) BE = D/W (6) Where D is the throughput and W is the total channel bandwidth available to the system. Fig 6 illustrates that even without directional antennas; a clustered network still has better bandwidth efficiency than single hop network, as the resources can be used more efficiently.

  • Fig. 6. Bandwidth efficiency of a system against offered traffic

From the definition of ECR presented in section II, one could expect that the worst case for the ECR calculation is to assume that all the nodes are at transmitting power level 100%

  • f the time. The worst case ECR scenario for a given system

is given by ECRworst = sum nodes transmission power)/ (system‟s throughput). For such a scenario, the ECRworst will be inversely proportional to the throughput. The best case scenario for ECR (at its lowest) is to assume that a when a node is not transmitting any data, it enters a sleep mode and its power is zero. This of course is likely to be too optimistic as in does not reflect reality nodes will still consumes energy during sleep, idle and listening mode albeit it is much lower than energy requirement for transmission. Fig 7 illustrates the upper and lower bound ECR for the 3 different network scenarios. The abbreviations used in the Fig 7 are as follows; Sh is single hop network model, Cn is the clustered network model and Cb is the clustered network with directional applied at HBS. In the best case scenario, apart from Cn, there is almost no variation in ECR as offer traffic increases. Despite more power being consumed at higher offered traffic the relative increase in throughput allows the networks to maintain their efficiency compared to low offered traffic. In Cn, the best case ECR starts to increase at an offered traffic of about 100Mb/s, which indicates that beyond this point the system is becoming less efficient. This is caused by saturation in the throughput (see Fig. 5) and with an increasing number of nodes being called to transmit to support the higher traffic. In the worst

slide-5
SLIDE 5

case ECR scenarios, the three network models become more energy efficient with higher offered traffic. The worst case ECR approaches best case ECR at higher offer traffic, and this is because as offered traffic increases the number transmitting to support the higher traffic also increases (fewer nodes are in sleep mode).

  • Fig. 7. Best and worst case ECR for three different network models
  • Fig. 8 shows the energy reduction gain (ERG) for worst and

best case scenario of ECR by applying clustering to a single hop communication and by applying directional antenna at HBS to a clustered network.

  • Fig. 8. Best and worst case ECR for three different network models

Based on results shown in Fig.8, applying clustering to a single hop architecture can reduce its total energy consumption by up to 94% and 72%, for the best and worst case scenarios respectively. The total uplink energy saving can be further improved by applying directional antenna at HBS directed towards a cluster head. The ERG of applying directional to a cluster head are up to 97% and 88% for best and worst case scenario. Such a big improvement on reducing energy consumed by a clustered network is because most of the energy is consumed by the cluster head relaying cluster member‟s data to the HBS. In sensor networks, the cluster head energy consumption is shared amongst all the nodes in the system via load balancing act [1, 2]. Their cluster head role is rotated periodically between the nodes in the system. A constant change in cluster formation can cause high overhead and increase channel contentions amongst user. Therefore given that we can exploit external power sources generally in fixed/portable broadband systems, and in order to support high traffic, we have opted to allow the cluster head to change periodically to adapt traffic pattern change. By having a directional antenna on the HBS, the cluster head can significantly reduce its transmit power whilst maintaining the required SINR.

  • V. CONCLUSION

In this paper we have illustrated that hierarchical topologies made up of an access network and backhaul network can reduce energy consumption. By using clustering techniques such dual hop networks can be formed on an ad hoc basis, with the cluster head connecting directly with a Hub Base

  • Station. Such architectures enable nodes to transmit at lower

power overall, while also concentrating traffic on to a few nodes which operate more continuously, which with some broadband devices will be more energy efficient. Formation of an efficient cluster can also reduce the channel contention amongst users and thus improves the system bandwidth efficiency thereby supporting higher traffic. The energy consumed by a cluster head can significantly be reduced by the use of directional antenna. The directional also brings an added advantage of reducing interference in the system. REFERENCES

[1] W. R. Heinzelman, A. Chandrakasan, and H. Balakrishnan, “An Application-Specific Protocol Architecture for Wireless Microsensor Networks,” IEEE Transactions on Wireless Communications, vol. 1,

  • no. 4, pp. 660–670, October 2002.

[2] Younis and S. Fahmy, “Distributed clustering inad hoc sensor networks: A hybrid, energe-efficient approach,” IEEE Transactions on Mobile Computing, vol.3, no. 4, pp. 366–379, 2004. [3] P.F.Tsuchiya, “The landmark hierarchy: a new hierarchy for routing in very large networks”, In Symposium Proceedings on Communications Architectures and Protocols (SIGCOMM’88), pages 35–42, 1988. [4] B. Badic et al., Energy Efficient Radio Access Architectures for Green Radio: Large versus Small Cell Size Deployment, IEEE VTC Fall, 2009. [5] A. Ramli, D. Grace, RF Signal Strength based Clustering Protocols for a Self-Organizing Cognitive Radio Network, IEEE International Symposium on Wireless Communication Systems (ISWCS) 2010, York, UK, September 2010 [6] M.Bublin, J. Pan, I. Kambourov, and P. Slanina, "Distributed spectrum sharing by reinforcement and game theory," presented at 5th Karlsruhe workshop on software radio, Karlsruhe, Germany, March. 2008. [7] WINNER, "IST-4-027756 WINNER II D1.1.2 V1.1: WINNER II Channel Models," 2007. [8] "LTE - Evolved Universal Terrestrial Radio Access (E-UTRA) Radio Frequency (RF) system scenarios," 3GPP Technical Specification Group Radio Access Networks April 2010 [9] M. Bloem, T. Alpcan, and T. Basar, “A Stackelberg Game for Power Control and Channel Allocation in Cognitive Radio Networks,” in GameComm 2007. France, Oct. 2007. [10] Arne Simonsson and Anders Furuskär, “Uplink Power Control in LTE

  • Overview and Performance”, Vehicular Technology Conference,

VTC 2008-Fall. IEEE 68th, 21-24 Sept. 2008. [11] "BuNGee Deliverable: D1.2, Baseline BuNGee Architecture," January 2010 [12] T. Jiang, D. Grace, and Y. Liu, "Performance of Cognitive Radio Reinforcement Spectrum Sharing Using Different Weighting Factors," in The International Workshop on Cognitive Networks and Communications (COGCOM2008) in conjunction with CHINACOM'08, Hangzhou, China, August, 2008.