
SLIDE 1
Lecture 10: High Dimensionality
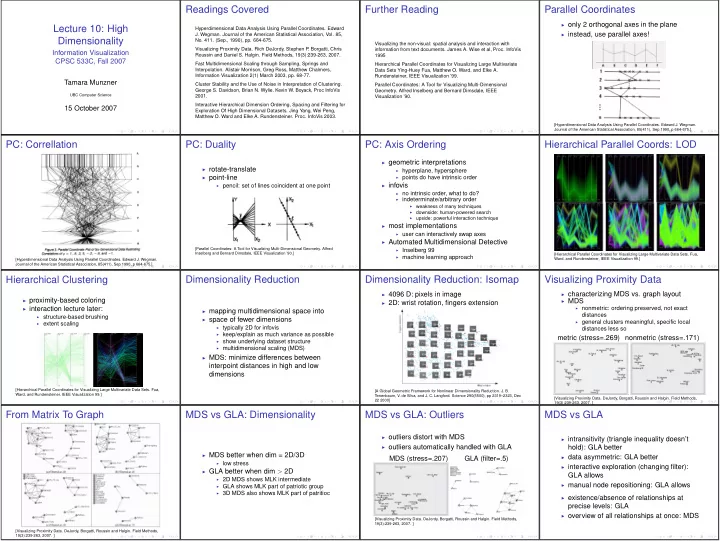
Information Visualization CPSC 533C, Fall 2007 Tamara Munzner UBC Computer Science 15 October 2007Readings Covered
Hyperdimensional Data Analysis Using Parallel Coordinates. Edward- J. Wegman. Journal of the American Statistical Association, Vol. 85,
- No. 411. (Sep., 1990), pp. 664-675.
- Interpolation. Alistair Morrison, Greg Ross, Matthew Chalmers,
Further Reading
Visualizing the non-visual: spatial analysis and interaction with information from text documents. James A. Wise et al, Proc. InfoVis 1995 Hierarchical Parallel Coordinates for Visualizing Large Multivariate Data Sets Ying-Huey Fua, Matthew O. Ward, and Elke A. Rundensteiner, IEEE Visualization ’99. Parallel Coordinates: A Tool for Visualizing Multi-Dimensional- Geometry. Alfred Inselberg and Bernard Dimsdale, IEEE
Parallel Coordinates
◮ only 2 orthogonal axes in the plane ◮ instead, use parallel axes! [Hyperdimensional Data Analysis Using Parallel Coordinates. Edward J. Wegman. Journal of the American Statistical Association, 85(411), Sep 1990, p 664-675.]PC: Correllation
[Hyperdimensional Data Analysis Using Parallel Coordinates. Edward J. Wegman. Journal of the American Statistical Association, 85(411), Sep 1990, p 664-675.]PC: Duality
◮ rotate-translate ◮ point-line ◮ pencil: set of lines coincident at one point [Parallel Coordinates: A Tool for Visualizing Multi-Dimensional Geometry. Alfred Inselberg and Bernard Dimsdale, IEEE Visualization ’90.]PC: Axis Ordering
◮ geometric interpretations ◮ hyperplane, hypersphere ◮ points do have intrinsic order ◮ infovis ◮ no intrinsic order, what to do? ◮ indeterminate/arbitrary order ◮ weakness of many techniques ◮ downside: human-powered search ◮ upside: powerful interaction technique ◮ most implementations ◮ user can interactively swap axes ◮ Automated Multidimensional Detective ◮ Inselberg 99 ◮ machine learning approachHierarchical Parallel Coords: LOD
[Hierarchical Parallel Coordinates for Visualizing Large Multivariate Data Sets. Fua, Ward, and Rundensteiner, IEEE Visualization 99.]Hierarchical Clustering
◮ proximity-based coloring ◮ interaction lecture later: ◮ structure-based brushing ◮ extent scaling [Hierarchical Parallel Coordinates for Visualizing Large Multivariate Data Sets. Fua, Ward, and Rundensteiner, IEEE Visualization 99.]Dimensionality Reduction
◮ mapping multidimensional space into ◮ space of fewer dimensions ◮ typically 2D for infovis ◮ keep/explain as much variance as possible ◮ show underlying dataset structure ◮ multidimensional scaling (MDS) ◮ MDS: minimize differences between interpoint distances in high and low dimensionsDimensionality Reduction: Isomap
◮ 4096 D: pixels in image ◮ 2D: wrist rotation, fingers extension [A Global Geometric Framework for Nonlinear Dimensionality Reduction. J. B. Tenenbaum, V. de Silva, and J. C. Langford. Science 290(5500), pp 2319–2323, Dec 22 2000]Visualizing Proximity Data
◮ characterizing MDS vs. graph layout ◮ MDS ◮ nonmetric: ordering preserved, not exact distances ◮ general clusters meaningful, specific local distances less so metric (stress=.269) nonmetric (stress=.171) [Visualizing Proximity Data. DeJordy, Borgatti, Roussin and Halgin. Field Methods, 19(3):239-263, 2007. ]From Matrix To Graph
[Visualizing Proximity Data. DeJordy, Borgatti, Roussin and Halgin. Field Methods, 19(3):239-263, 2007. ]MDS vs GLA: Dimensionality
◮ MDS better when dim = 2D/3D ◮ low stress ◮ GLA better when dim > 2D ◮ 2D MDS shows MLK intermediate ◮ GLA shows MLK part of patriotic group ◮ 3D MDS also shows MLK part of patritiocMDS vs GLA: Outliers
◮ outliers distort with MDS ◮ outliers automatically handled with GLA MDS (stress=.207) GLA (filter=.5) [Visualizing Proximity Data. DeJordy, Borgatti, Roussin and Halgin. Field Methods, 19(3):239-263, 2007. ]MDS vs GLA
◮ intransitivity (triangle inequality doesn’t hold): GLA better ◮ data asymmetric: GLA better ◮ interactive exploration (changing filter): GLA allows ◮ manual node repositioning: GLA allows ◮ existence/absence of relationships at precise levels: GLA ◮ overview of all relationships at once: MDS