
SLIDE 1
Lecture 4: Frameworks/Models
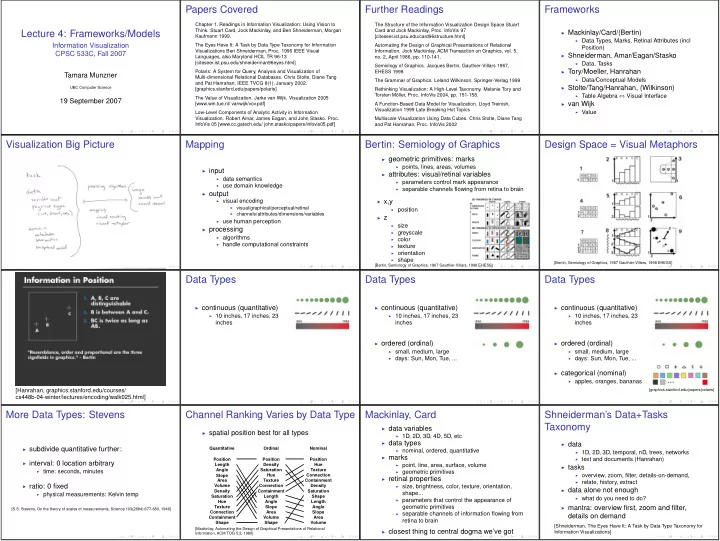
Information Visualization CPSC 533C, Fall 2007 Tamara Munzner UBC Computer Science 19 September 2007Papers Covered
Chapter 1, Readings in Information Visualization: Using Vision to- Think. Stuart Card, Jock Mackinlay, and Ben Shneiderman, Morgan
- Visualization. Robert Amar, James Eagan, and John Stasko. Proc.
Further Readings
The Structure of the Information Visualization Design Space Stuart Card and Jock Mackinlay, Proc. InfoVis 97 [citeseer.ist.psu.edu/card96structure.html] Automating the Design of Graphical Presentations of Relational- Information. Jock Mackinlay, ACM Transaction on Graphics, vol. 5,
- no. 2, April 1986, pp. 110-141.
- ller, Proc. InfoVis 2004, pp. 151-158.
Frameworks
◮ Mackinlay/Card/(Bertin) ◮ Data Types, Marks, Retinal Attributes (incl Position) ◮ Shneiderman, Amar/Eagan/Stasko ◮ Data, Tasks ◮ Tory/Moeller, Hanrahan ◮ Data/Conceptual Models ◮ Stolte/Tang/Hanrahan, (Wilkinson) ◮ Table Algebra ⇔ Visual Interface ◮ van Wijk ◮ ValueVisualization Big Picture Mapping
◮ input ◮ data semantics ◮ use domain knowledge ◮ output ◮ visual encoding ◮ visual/graphical/perceptual/retinal ◮ channels/attributes/dimensions/variables ◮ use human perception ◮ processing ◮ algorithms ◮ handle computational constraintsBertin: Semiology of Graphics
◮ geometric primitives: marks ◮ points, lines, areas, volumes ◮ attributes: visual/retinal variables ◮ parameters control mark appearance ◮ separable channels flowing from retina to brain ◮ x,y ◮ position ◮ z ◮ size ◮ greyscale ◮ color ◮ texture ◮ orientation ◮ shape [Bertin, Semiology of Graphics, 1967 Gauthier-Villars, 1998 EHESS]Design Space = Visual Metaphors
[Bertin, Semiology of Graphics, 1967 Gauthier-Villars, 1998 EHESS] [Hanrahan, graphics.stanford.edu/courses/ cs448b-04-winter/lectures/encoding/walk025.html]Data Types
◮ continuous (quantitative) ◮ 10 inches, 17 inches, 23 inchesData Types
◮ continuous (quantitative) ◮ 10 inches, 17 inches, 23 inches ◮ ordered (ordinal) ◮ small, medium, large ◮ days: Sun, Mon, Tue, ...Data Types
◮ continuous (quantitative) ◮ 10 inches, 17 inches, 23 inches ◮ ordered (ordinal) ◮ small, medium, large ◮ days: Sun, Mon, Tue, ... ◮ categorical (nominal) ◮ apples, oranges, bananas [graphics.stanford.edu/papers/polaris]More Data Types: Stevens
◮ subdivide quantitative further: ◮ interval: 0 location arbitrary ◮ time: seconds, minutes ◮ ratio: 0 fixed ◮ physical measurements: Kelvin temp [S.S. Stevens, On the theory of scales of measurements, Science 103(2684):677-680, 1946]Channel Ranking Varies by Data Type
◮ spatial position best for all types Position Texture Connection Containment Density Shape Length Angle Slope Area Volume Position Length Angle Slope Area Volume Density Texture Containment Shape Connection Saturation Position Density Texture Connection Containment Length Angle Slope Area Volume Shape Saturation Saturation Hue Hue Hue Nominal Ordinal Quantitative [Mackinlay, Automating the Design of Graphical Presentations of Relational Information, ACM TOG 5:2, 1986]Mackinlay, Card
◮ data variables ◮ 1D, 2D, 3D, 4D, 5D, etc ◮ data types ◮ nominal, ordered, quantitative ◮ marks ◮ point, line, area, surface, volume ◮ geometric primitives ◮ retinal properties ◮ size, brightness, color, texture, orientation, shape... ◮ parameters that control the appearance of geometric primitives ◮ separable channels of information flowing from retina to brain ◮ closest thing to central dogma we’ve gotShneiderman’s Data+Tasks Taxonomy
◮ data ◮ 1D, 2D, 3D, temporal, nD, trees, networks ◮ text and documents (Hanrahan) ◮ tasks ◮ overview, zoom, filter, details-on-demand, ◮ relate, history, extract ◮ data alone not enough ◮ what do you need to do? ◮ mantra: overview first, zoom and filter, details on demand [Shneiderman, The Eyes Have It: A Task by Data Type Taxonomy for Information Visualizations]