
SLIDE 1
RANDOM FORESTS IN THE EVALUATION OF THREAT FOR PEDESTRIAN ACCIDENTS - - PDF document
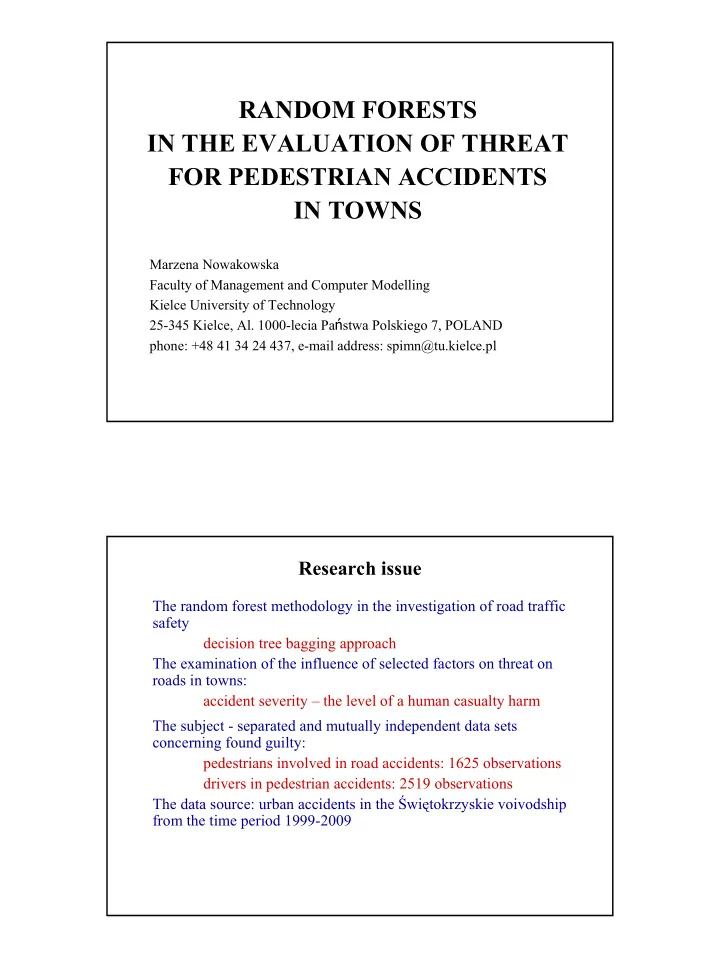
RANDOM FORESTS IN THE EVALUATION OF THREAT FOR PEDESTRIAN ACCIDENTS IN TOWNS Marzena Nowakowska Faculty of Management and Computer Modelling Kielce University of Technology 25-345 Kielce, Al. 1000-lecia Pa stwa Polskiego 7, POLAND phone:
Leaf Leaf Leaf Node: test X3 Leaf: d1 Leaf Leaf Node: test X2 Tree root: test X1 X1(z)=a X2(z)=b X3(z)=c
X1(z)=a ∧ X2(z)=b ∧ X3(z)=c ⇒ Y = d1 X1(z)=a ∧ X2(z)=b ∧ X3(z)=c ⇒ {P(Y = d1), ..., P(Y = dk)} )} X ( AI { max ) X ( AI ) X ( Importance
j j i i =
∑
∈
=
) t | X ( B b b i
i
) t Y ( SSE
t Y ( SSE ) X ( AI | | where SSE(Y|t) and SSE(Y|tb) are the sums
splitting the data set according to the variable Xi respectively. Importance ∈<0; 1>
Original data set Train data sets Decision trees constituting the random forest
substances Pd_BAC : Y, N
ImEnBhVh, InCrRd*, PrRd*, OtPdBh*
HVh (bus, truck), OVh (other vehicle types)
Accident severity Ac_Sv:
pedestrian data set: 61.1% MA, 31.8% SA, 7.1% FA driver data set: 59.1% MA, 33.7% SA, 7.3% FA
The final domain of AcSv: MA, FSA = FA+SA
7 14 20 35 50 65 1 2 3 4 5 6 7
Dr_BAC : Y, N
InMnGrSp*, InMnSmSp*, InBhTwPd*, OtDrBv*
1 2 3 4 5 6 7 4 8 12 16 21 26 Small Medium Big Very big
20000 50000 100000
50% of FSA (15%+35% of FA+SA)
from 1002 to 1029
AMean – the arithmetic mean: AMean=Σzi /n HMean – the harmonic mean: HMean=n/Σ(1/zi )
SNS SPC PCC HMSS SNS SPC PCC HMSS Min [%] 59.6 48.9 63.2 60.0 49.2 49.2 54.6 55.3 Max [%] 77.5 71.0 66.5 66.3 70.0 68.0 61.9 62.5 AMean [%] 65.9 64.5 65.2 64.7 57.9 58.6 58.2 57.8 HMean [%] 65.6 63.8 65.2 64.7 57.4 58 58.1 57.7 Specification Train data sets Test data sets
SNS SPC PCC HMSS SNS SPC PCC HMSS Min [%] 53.2 56.7 60.0 59.3 48.8 49.8 53.5 54.0 Max [%] 64.6 68.1 63.2 62.8 63.5 69.9 61.6 60.0 AMean [%] 59.9 62.6 61.2 61.0 54.5 59.3 57.3 56.3 HMean [%] 59.7 62.3 61.2 61.0 54.0 58.8 57.2 56.3 Specification Train data sets Test data sets
50% of FSA (15%+35% of FA+SA)
from 1529 to 1573
0,2 0,4 0,6 0,8 1 1,2
Vhl City Dr_Gn Dr_BAC Drvg Dr_Bhv Importance % of occurrence
0% 20% 40% 60% 80% 100% 120%
0,00 0,20 0,40 0,60 0,80 1,00 1,20 Vhl City Pd_Gn Pd_BAC Pd_Ag Pd_Bhv Importance % of occurrence 0% 20% 40% 60% 80% 100% 120%
0,25 0,35 0,45 0,55 0,65 0,75 <0; 7) <7; 14) <14; 20) <20; 35) <35;50) <50; 65) >=65ImEnFrVh InCrRd ImEnBhVh PrRd
Very big city 0,25 0,35 0,45 0,55 0,65 0,75 <0; 7) <7; 14) <14; 20) <20; 35) <35;50) <50; 65) >=65 Big city 0,25 0,35 0,45 0,55 0,65 0,75 <0; 7) <7; 14) <14; 20) <20; 35) <35;50) <50; 65) >=65 Medium city 0,25 0,35 0,45 0,55 0,65 0,75 <0; 7) <7; 14) <14; 20) <20; 35) <35;50) <50; 65) >=65 Small city 0,25 0,35 0,45 0,55 0,65 0,75 <0; 7) <7; 14) <14; 20) <20; 35) <35;50) <50; 65) >=65
Very big city Big city Medium city Small city
0,2 0,3 0,4 0,5 0,6 0,7 0,8 (0;7> <14;20) <35;50) >=65 <7;14) <20;35) <50;65) (0;7> <14;20) <35;50) >=65 <7;14) <20;35) <50;65) ImEnFrVh InCrRd ImEnBhVh PrRd 0,2 0,3 0,4 0,5 0,6 0,7 0,8 (0;7> <14;20) <35;50) >=65 <7;14) <20;35) <50;65) (0;7> <14;20) <35;50) >=65 <7;14) <20;35) <50;65) ImEnFrVh InCrRd ImEnBhVh PrRd 0,2 0,3 0,4 0,5 0,6 0,7 0,8 (0;7> <14;20) <35;50) >=65 <7;14) <20;35) <50;65) (0;7> <14;20) <35;50) >=65 <7;14) <20;35) <50;65) ImEnFrVh InCrRd ImEnBhVh PrRd 0,2 0,3 0,4 0,5 0,6 0,7 0,8 (0;7> <14;20) <35;50) >=65 <7;14) <20;35) <50;65) (0;7> <14;20) <35;50) >=65 <7;14) <20;35) <50;65) ImEnFrVh InCrRd ImEnBhVh PrRd
0,2 0,3 0,4 0,5 0,6 0,7 0,8 (0;7 <35; <7;1 <50; <14; >=6 <20;Car Heavy vehicle
1
2 3 4
Very big city 0,35 0,40 0,45 0,50 0,55 0,60 0,65 0,70 0,75 <0; 4) <4; 8) <8; 12) <12; 16) <16; 21) <21; 26) >=26 Big city 0,35 0,40 0,45 0,50 0,55 0,60 0,65 0,70 0,75 <0; 4) <4; 8) <8; 12) <12; 16) <16; 21) <21; 26) >=26 Medium city 0,35 0,40 0,45 0,50 0,55 0,60 0,65 0,70 0,75 <0; 4) <4; 8) <8; 12) <12; 16) <16; 21) <21; 26) >=26 Small city 0,35 0,40 0,45 0,50 0,55 0,60 0,65 0,70 0,75 <0; 4) <4; 8) <8; 12) <12; 16) <16; 21) <21; 26) >=26
0,30 0,80 <0; 4) <4; 8) <8; 12) <12; 16) <16; 21) <21; 26) >=26InBhTwPd ExSp NtGvWay InMnGrSp InMnSmSp
0,35 0,40 0,45 0,50 0,55 0,60 0,65 0,70 0,75 <0; 4) <4; 8) <8; 12) <12; 16) <16; 21) <21; 26) >=26 <0; 4) <4; 8) <8; 12) <12; 16) <16; 21) <21; 26) >=26 <0; 4) <4; 8) <8; 12) <12; 16) <16; 21) <21; 26) >=26 <0; 4) <4; 8) <8; 12) <12; 16) <16; 21) <21; 26) >=26 <0; 4) <4; 8) <8; 12) <12; 16) <16; 21) <21; 26) >=26 Very big Big Medium Small InBhTwPd ExSp NtGvWay InMnGrSp InMnSmSp
1
2 3 4
with the age of a road user at guilt
age of 50, then it varies
driving experience increases
years of driving experience, then it decreases up to 21 years, then it increases
classification
classification
and the driver behaviour