
SLIDE 1
Laurence Court PhD University of Texas MD Anderson Cancer Center
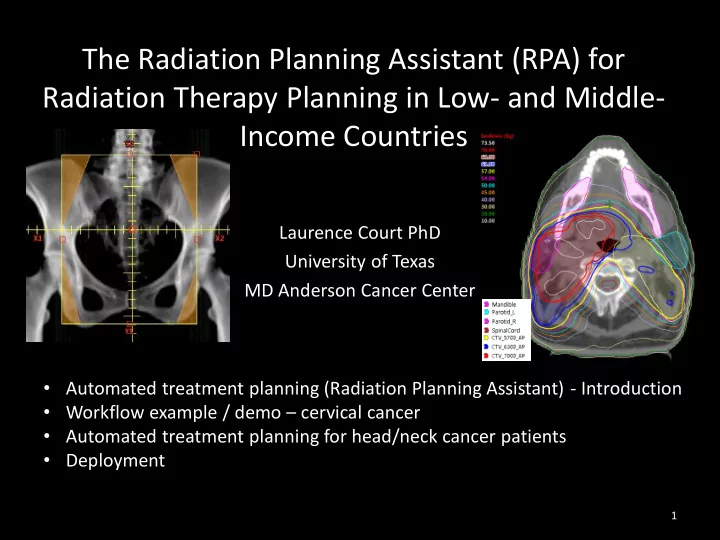
The Radiation Planning Assistant (RPA) for Radiation Therapy Planning in Low- and Middle- Income Countries
1
- Automated treatment planning (Radiation Planning Assistant) - Introduction
- Workflow example / demo – cervical cancer
- Automated treatment planning for head/neck cancer patients
- Deployment