
9/11/2017 1
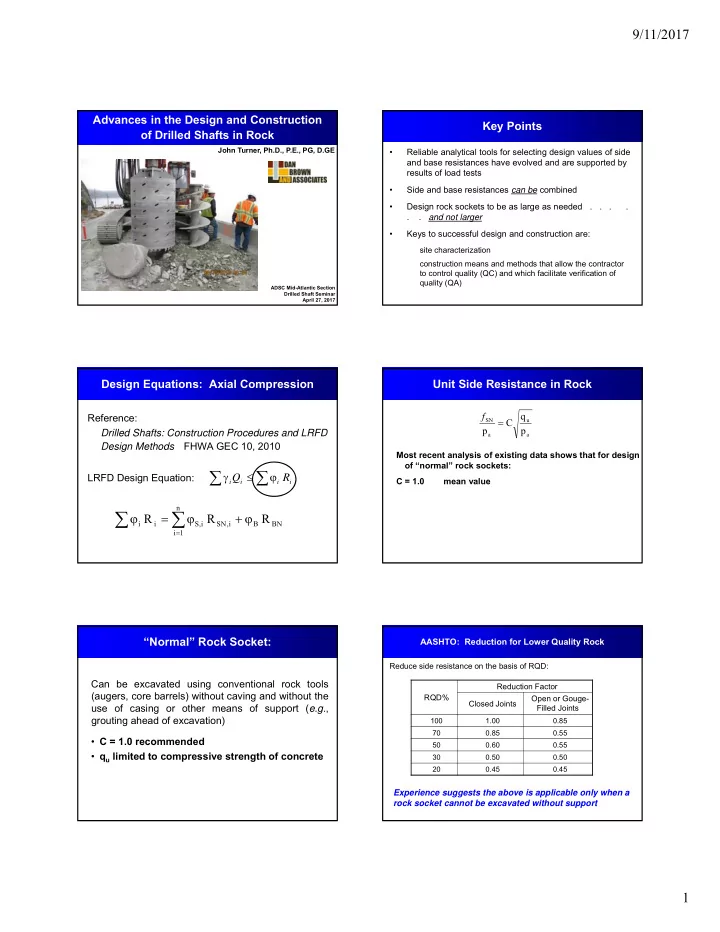
Advances in the Design and Construction
- f Drilled Shafts in Rock
John Turner, Ph.D., P.E., PG, D.GE
ADSC Mid-Atlantic Section Drilled Shaft Seminar April 27, 2017
Key Points
- Reliable analytical tools for selecting design values of side
and base resistances have evolved and are supported by results of load tests
- Side and base resistances can be combined
- Design rock sockets to be as large as needed . . . .
. . and not larger
- Keys to successful design and construction are:
site characterization construction means and methods that allow the contractor to control quality (QC) and which facilitate verification of quality (QA)
Design Equations: Axial Compression
Reference: Drilled Shafts: Construction Procedures and LRFD Design Methods FHWA GEC 10, 2010 LRFD Design Equation:
BN B n 1 i i , SN i , S i i
R R R
i i i i
R Q Unit Side Resistance in Rock
Most recent analysis of existing data shows that for design
- f “normal” rock sockets:
C = 1.0 mean value
a u a SN
p q C p f
“Normal” Rock Socket:
Can be excavated using conventional rock tools (augers, core barrels) without caving and without the use of casing or other means of support (e.g., grouting ahead of excavation)
- C = 1.0 recommended
- qu limited to compressive strength of concrete
AASHTO: Reduction for Lower Quality Rock
Reduce side resistance on the basis of RQD: RQD% Reduction Factor Closed Joints Open or Gouge- Filled Joints
100 1.00 0.85 70 0.85 0.55 50 0.60 0.55 30 0.50 0.50 20 0.45 0.45
Experience suggests the above is applicable only when a rock socket cannot be excavated without support