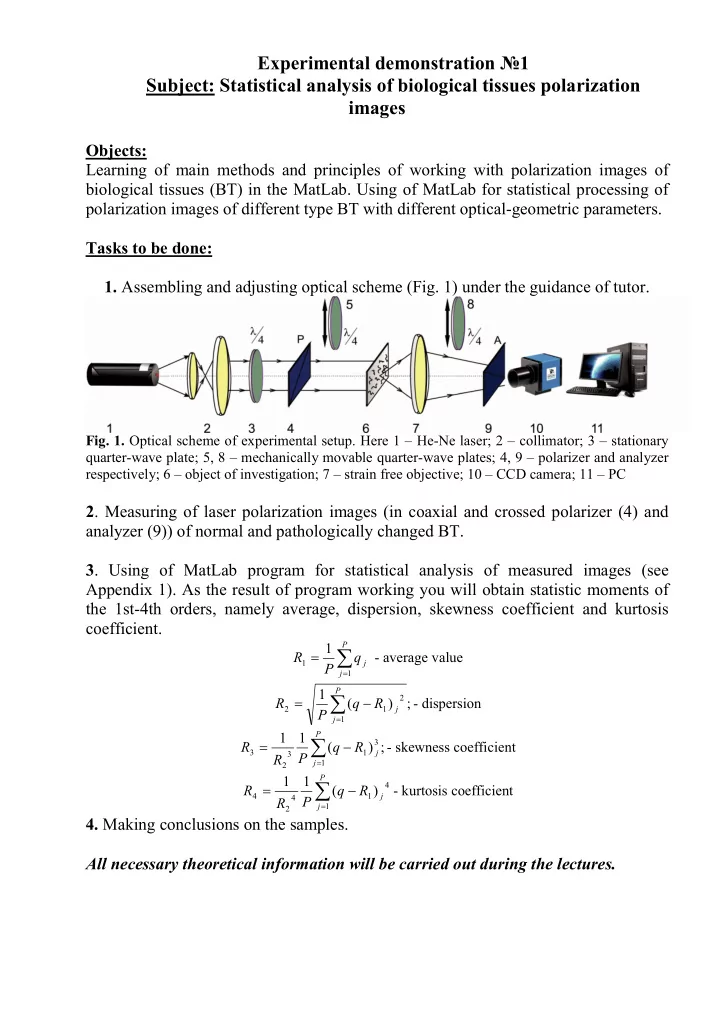
SLIDE 9 figure (2) subplot(2,2,1),imshow(M21,[min(min(M21)) max(max(M21))]),title (['M21'],'Color','b');colorbar,colormap(jet); subplot(2,2,2),imshow(M22,[min(min(M22)) max(max(M22))]),title (['M22'],'Color','b');colorbar,colormap(jet); subplot(2,2,3),imshow(M23,[min(min(M23)) max(max(M23))]),title (['M23'],'Color','b');colorbar,colormap(jet); subplot(2,2,4),imshow(M24,[min(min(M24)) max(max(M24))]),title (['M24'],'Color','b');colorbar,colormap(jet); figure (3) subplot(2,2,1),imshow(M31,[min(min(M31)) max(max(M31))]),title (['M31'],'Color','b');colorbar,colormap(jet); subplot(2,2,2),imshow(M32,[min(min(M32)) max(max(M32))]),title (['M32'],'Color','b');colorbar,colormap(jet); subplot(2,2,3),imshow(M33,[min(min(M33)) max(max(M33))]),title (['M33'],'Color','b');colorbar,colormap(jet); subplot(2,2,4),imshow(M34,[min(min(M34)) max(max(M34))]),title (['M34'],'Color','b');colorbar,colormap(jet); figure (4) subplot(2,2,1),imshow(M41,[min(min(M41)) max(max(M41))]),title (['M41'],'Color','b');colorbar,colormap(jet); subplot(2,2,2),imshow(M42,[min(min(M42)) max(max(M42))]),title (['M42'],'Color','b');colorbar,colormap(jet); subplot(2,2,3),imshow(M43,[min(min(M43)) max(max(M43))]),title (['M43'],'Color','b');colorbar,colormap(jet); subplot(2,2,4),imshow(M44,[min(min(M44)) max(max(M44))]),title (['M44'],'Color','b');colorbar,colormap(jet); figure (5); subplot(2,2,1),imshow(M11,[min(min(M11)) max(max(M11))]),title (['M11'],'Color','b');colorbar,colormap(gray); subplot(2,2,2),imshow(M12,[min(min(M12)) max(max(M12))]),title (['M12'],'Color','b');colorbar,colormap(gray); subplot(2,2,3),imshow(M13,[min(min(M13)) max(max(M13))]),title (['M13'],'Color','b');colorbar,colormap(gray); subplot(2,2,4),imshow(M14,[min(min(M14)) max(max(M14))]),title (['M14'],'Color','b');colorbar,colormap(gray); figure (6) subplot(2,2,1),imshow(M21,[min(min(M21)) max(max(M21))]),title (['M21'],'Color','b');colorbar,colormap(gray); subplot(2,2,2),imshow(M22,[min(min(M22)) max(max(M22))]),title (['M22'],'Color','b');colorbar,colormap(gray); subplot(2,2,3),imshow(M23,[min(min(M23)) max(max(M23))]),title (['M23'],'Color','b');colorbar,colormap(gray); subplot(2,2,4),imshow(M24,[min(min(M24)) max(max(M24))]),title (['M24'],'Color','b');colorbar,colormap(gray); figure (7) subplot(2,2,1),imshow(M31,[min(min(M31)) max(max(M31))]),title (['M31'],'Color','b');colorbar,colormap(gray); subplot(2,2,2),imshow(M32,[min(min(M32)) max(max(M32))]),title (['M32'],'Color','b');colorbar,colormap(gray); subplot(2,2,3),imshow(M33,[min(min(M33)) max(max(M33))]),title (['M33'],'Color','b');colorbar,colormap(gray); subplot(2,2,4),imshow(M34,[min(min(M34)) max(max(M34))]),title (['M34'],'Color','b');colorbar,colormap(gray); figure (8) subplot(2,2,1),imshow(M41,[min(min(M41)) max(max(M41))]),title (['M41'],'Color','b');colorbar,colormap(gray); subplot(2,2,2),imshow(M42,[min(min(M42)) max(max(M42))]),title (['M42'],'Color','b');colorbar,colormap(gray); subplot(2,2,3),imshow(M43,[min(min(M43)) max(max(M43))]),title (['M43'],'Color','b');colorbar,colormap(gray); subplot(2,2,4),imshow(M44,[min(min(M44)) max(max(M44))]),title (['M44'],'Color','b');colorbar,colormap(gray); figure (9) subplot(2,2,1),imshow(M11,[-1 1]),title (['M11'],'Color','b');colorbar,colormap(jet); subplot(2,2,2),imshow(M12,[-1 1]),title (['M12'],'Color','b');colorbar,colormap(jet); subplot(2,2,3),imshow(M13,[-1 1]),title (['M13'],'Color','b');colorbar,colormap(jet); subplot(2,2,4),imshow(M14,[-1 1]),title (['M14'],'Color','b');colorbar,colormap(jet); figure (10) subplot(2,2,1),imshow(M21,[-1 1]),title (['M21'],'Color','b');colorbar,colormap(jet); subplot(2,2,2),imshow(M22,[-1 1]),title (['M22'],'Color','b');colorbar,colormap(jet); subplot(2,2,3),imshow(M23,[-1 1]),title (['M23'],'Color','b');colorbar,colormap(jet); subplot(2,2,4),imshow(M24,[-1 1]),title (['M24'],'Color','b');colorbar,colormap(jet); figure (11) subplot(2,2,1),imshow(M31,[-1 1]),title (['M31'],'Color','b');colorbar,colormap(jet); subplot(2,2,2),imshow(M32,[-1 1]),title (['M32'],'Color','b');colorbar,colormap(jet); subplot(2,2,3),imshow(M33,[-1 1]),title (['M33'],'Color','b');colorbar,colormap(jet); subplot(2,2,4),imshow(M34,[-1 1]),title (['M34'],'Color','b');colorbar,colormap(jet); figure (12) subplot(2,2,1),imshow(M41,[-1 1]),title (['M41'],'Color','b');colorbar,colormap(jet); subplot(2,2,2),imshow(M42,[-1 1]),title (['M42'],'Color','b');colorbar,colormap(jet); subplot(2,2,3),imshow(M43,[-1 1]),title (['M43'],'Color','b');colorbar,colormap(jet); subplot(2,2,4),imshow(M44,[-1 1]),title (['M44'],'Color','b');colorbar,colormap(jet); figure (13) subplot(2,2,1),imshow(M11,[-1 1]),title (['M11'],'Color','b');colorbar,colormap(gray); subplot(2,2,2),imshow(M12,[-1 1]),title (['M12'],'Color','b');colorbar,colormap(gray); subplot(2,2,3),imshow(M13,[-1 1]),title (['M13'],'Color','b');colorbar,colormap(gray); subplot(2,2,4),imshow(M14,[-1 1]),title (['M14'],'Color','b');colorbar,colormap(gray); figure (14) subplot(2,2,1),imshow(M21,[-1 1]),title (['M21'],'Color','b');colorbar,colormap(gray); subplot(2,2,2),imshow(M22,[-1 1]),title (['M22'],'Color','b');colorbar,colormap(gray); subplot(2,2,3),imshow(M23,[-1 1]),title (['M23'],'Color','b');colorbar,colormap(gray); subplot(2,2,4),imshow(M24,[-1 1]),title (['M24'],'Color','b');colorbar,colormap(gray); figure (15) subplot(2,2,1),imshow(M31,[-1 1]),title (['M31'],'Color','b');colorbar,colormap(gray); subplot(2,2,2),imshow(M32,[-1 1]),title (['M32'],'Color','b');colorbar,colormap(gray); subplot(2,2,3),imshow(M33,[-1 1]),title (['M33'],'Color','b');colorbar,colormap(gray); subplot(2,2,4),imshow(M34,[-1 1]),title (['M34'],'Color','b');colorbar,colormap(gray); figure (16)