SLIDE 1
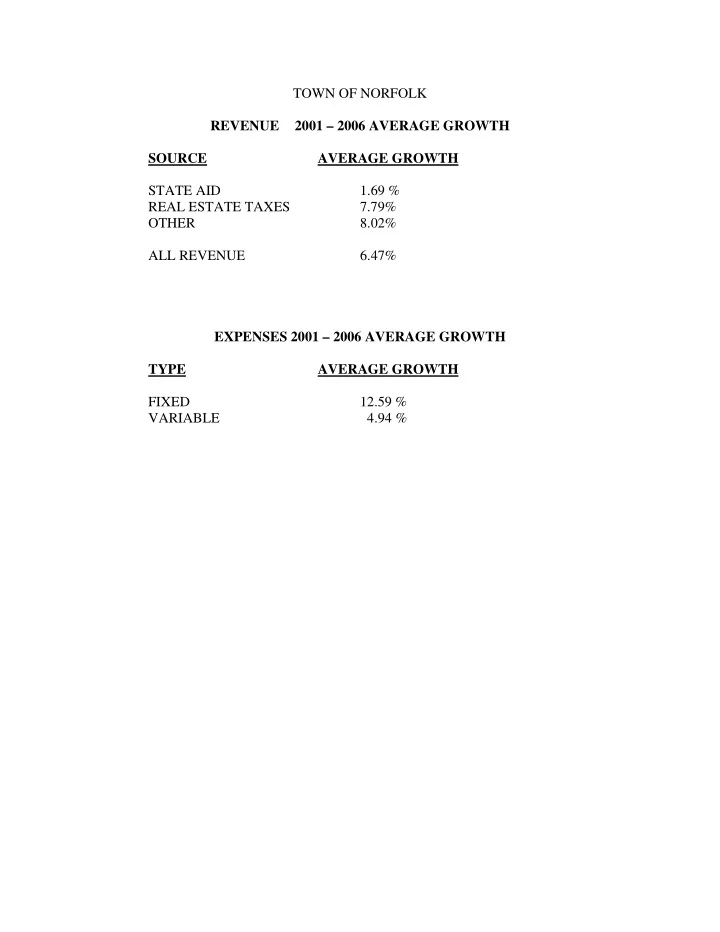
TOWN OF NORFOLK REVENUE 2001 – 2006 AVERAGE GROWTH SOURCE AVERAGE GROWTH STATE AID 1.69 % REAL ESTATE TAXES 7.79% OTHER 8.02% ALL REVENUE 6.47% EXPENSES 2001 – 2006 AVERAGE GROWTH TYPE AVERAGE GROWTH FIXED 12.59 % VARIABLE 4.94 %
SLIDE 2
Budgeted Revenues & Expenses (Net of Excluded Revenue and Debt Service) $21,875,754 $17,434,642 $21,762,637 $22,452,186 $16,531,751 $18,154,389 $19,598,118 $20,492,033 $21,244,078 $24,411,249 Recommended $18,767,862 $20,501,249
$16,000,000 $17,000,000 $18,000,000 $19,000,000 $20,000,000 $21,000,000 $22,000,000 $23,000,000 $24,000,000 $25,000,000
FY01 FY02 FY03 FY04 FY05 FY06
Revenue Recommended Exp Balanced Exp
$ 23,035,599 Balanced
SLIDE 3
Other Sources of Revenue How we have filled the gap! $0 $500 $1,000 $1,500 $2,000 $2,500 $3,000 FY01 FY02 FY03 FY04 FY05 FY06
Thousands
Ambulance Fund Cemetery Cops FAST Free Cash Worker's Comp Overlay Override Water Revenue (Debt)
SLIDE 4
Town of Norfolk Budgeted - Net of School Building Assistance and Excluded Revenue and Debt Service Expenses vs. Revenues
$17.4 $18.8 $20.5 $21.8 $22.5 $23.0 $24.4 $16.5 $18.2 $19.6 $20.5 $21.2 $21.9 $21.9
$- $5 $10 $15 $20 $25 $30
FY01 FY02 FY03 FY04 FY05 FY06 Balanced FY06 Recommended Millions
Expenses Revenues
SLIDE 5
Norfolk Budgeted Revenue FY01 - FY06 (Does not include Debt Excluded Revenue & School Building Assistance) 5 10 15 20 25 FY01 FY02 FY03 FY04 FY05 FY06 Millions Average Growth All Revenue = 6.47 % Real Estate Revenues = 7.79 % State Aid = 1.69 % Other = 8.02 %
Local Revenue Real Estate Taxes New Growth State Aid
$21,875,755 $21,006,797 $20,003,053 $18,422,258 $16,531,751 $19,292,673
SLIDE 6
State Aid Education & General Government
$0 $1 $2 $3 $4
FY01 FY02 FY03 FY04 FY05
Aid in Millions
Education General Government
SLIDE 7
FY05 Accepted VS FY06 Balanced VS FY06 Recommended Budgeted Fixed & Variable Expenses - Does not include SBAB and Excluded Revenue and Debt Service
$8,307,662 $9,244,229 $9,300,157 $14,144,523 $13,791,370 $15,111,092 0% 10% 20% 30% 40% 50% 60% 70% 80% 90% 100% FY05 FY06 Balanced FY06 Recommended Fixed Expenses Variable Expenses
SLIDE 8
Town of Norfolk Variable Vs. Fixed Expenses
$- $5 $10 $15 $20 $25 $30 Millions Variable Expenses $12,119,490 $13,042,831 $13,807,738 $14,192,700 $14,144,523 $13,791,370 $15,111,092 Fixed Expenses $5,315,152 $5,725,031 $6,693,511 $7,569,937 $8,307,662 $9,244,229 $9,300,157 FY01 FY02 FY03 FY04 FY05 FY06 Balanced FY06 Recommended Average Variable Increase = 4.94 % Average Fixed Increase - 12.59%
SLIDE 9
Real Tax Revenue by Type
$8 $9 $10 $11 $12 $13 $14 $15 $16 FY01 FY02 FY03 FY04 FY05 Millions
Residential Commercial Industrial