Quigley Sub-Area Plan April 19, 2017 Don Kostelec, AICP Alta - - PowerPoint PPT Presentation

quigley sub area plan
SMART_READER_LITE
LIVE PREVIEW

Quigley Sub-Area Plan April 19, 2017 Don Kostelec, AICP Alta - - PowerPoint PPT Presentation

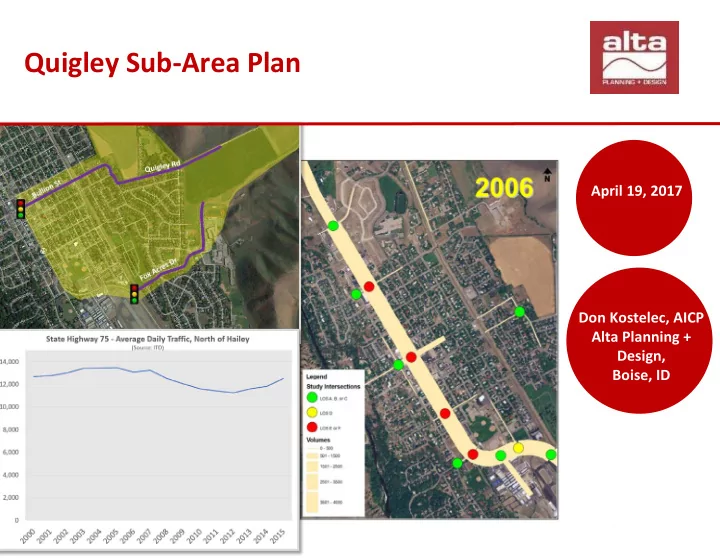
Quigley Sub-Area Plan April 19, 2017 Don Kostelec, AICP Alta Planning + Design, Boise, ID Photo Credit: Bike Walk Wichita Purpose A more focused evaluation of transportation network connectivity in the area served by Quigley Road


slide-1
SLIDE 1

Photo Credit: Bike Walk Wichita

Quigley Sub-Area Plan

Don Kostelec, AICP Alta Planning + Design, Boise, ID April 19, 2017

slide-2
SLIDE 2

Purpose

  • A more focused evaluation of

transportation network connectivity in the area served by Quigley Road and Fox Acres

  • What has happened since the Hailey

Transportation Master Plan was adopted nearly a decade ago?

  • What would be likely impacts of

buildout of proposed developments?

  • Help City provide guidance to current

proposed development on analysis and potential requirements

slide-3
SLIDE 3
slide-4
SLIDE 4

Hailey Transportation Plan

2026

slide-5
SLIDE 5

Hailey Transportation Plan

slide-6
SLIDE 6

Hailey Transportation Plan

slide-7
SLIDE 7

Collector Streets

slide-8
SLIDE 8

Collector Streets

  • Overall Goal: Distribute transportation users between local streets and

arterials

  • May serve as an “arterial” for pedestrians and bicyclists
  • Are part of a network to support their distribution function
slide-9
SLIDE 9

Collector Streets

?

slide-10
SLIDE 10

Why connectivity?

Source: Norm Garrick Presentation

Pre- 1950s Post-1950s

  • 1. It’s safer—for everyone.
  • 2. Creates redundancy in the network
  • 3. Better serves pedestrians, bicyclists & drivers
  • 4. Improves delivery & efficiency of city services
  • 5. Gives you more options for SH 75
slide-11
SLIDE 11

Why connectivity?

slide-12
SLIDE 12

Why connectivity for active transportation?

slide-13
SLIDE 13

Traffic Impacts

  • Roadway links function well and

are generally within acceptable thresholds (very common)

  • Intersections are where

vehicular traffic flow impacts

  • ccur
  • Fox Acres & SH 75 in buildout of

existing phase

  • Also influenced by other, past

developments in the area

slide-14
SLIDE 14

Quigley Development Traffic Impact Study

  • Agree with methods and science applied

throughout the study

  • Went beyond the norm for traffic counts

for this type of development

  • 1.6% “background” growth per year
  • Not a through highway, so little

traditional background growth

  • Therefore, it captures some level of

growth from other future development

  • Traffic volumes are low on almost every

street,

  • Therefore even large increases in % of

traffic does not impact Level of Service

slide-15
SLIDE 15

Quigley Development Traffic Impact Study

  • Existing traffic and buildout traffic
  • n Bullion (what is the change)
  • While it sounds high because it

goes from 105 to 250 in a peak

  • hour. That seems significant, but

the LOS does not change even with that amount of traffic.

  • Might be different if Bullion was
  • n the border of something

unacceptable, then it might look different

  • Croy & 8th – A now, B no-build, C

in worst case scenario

  • Numbers are low all-around;

Likely that many of the numbers

  • Do not see that it will increase

ff f ld l k l

slide-16
SLIDE 16

Fox Acres & SH 75

  • Currently: 85% of traffic

goes north; 15% goes south

  • Right turn from Fox Acres to

northbound SH 75 currently

  • ver capacity in AM peak

period

  • Assuming similar split and

worst case scenario of existing Quigley proposal (diagram at left)

AM Peak: TODAY

slide-17
SLIDE 17

Fox Acres & SH 75

  • Currently: 85% of traffic

goes north; 15% goes south

  • Right turn from Fox Acres to

northbound SH 75 currently

  • ver capacity in AM peak

period

  • Assuming similar split and

worst case scenario of existing Quigley proposal (diagram at left)

AM Peak: 2020 Buildout

slide-18
SLIDE 18

Traffic Impacts

slide-19
SLIDE 19

Conceptual Quigley Design Options

slide-20
SLIDE 20

Traffic Diversion & Traffic Management

slide-21
SLIDE 21

Traffic Diversion & Traffic Management

slide-22
SLIDE 22

Traffic Diversion & Traffic Management

slide-23
SLIDE 23

Traffic Diversion & Traffic Management

slide-24
SLIDE 24

Photo Credit: Bike Walk Wichita

QUESTIONS?