Quantitative analysis of Electron Diffraction Ring Patterns using - - PowerPoint PPT Presentation

quantitative analysis of electron diffraction ring
SMART_READER_LITE
LIVE PREVIEW

Quantitative analysis of Electron Diffraction Ring Patterns using - - PowerPoint PPT Presentation

Quantitative analysis of Electron Diffraction Ring Patterns using the MAUD program P. Boullay 1 , L. Lutterotti 2 and D. Chateigner 1 1 CRISMAT, CNRS UMR 6508, 6 Bd du Marchal JUIN 14050 CAEN Cedex, France 2 Department of Materials Engineering


slide-1
SLIDE 1

Quantitative analysis of Electron Diffraction Ring Patterns using the MAUD program

  • P. Boullay1, L. Lutterotti2 and D. Chateigner1

1 CRISMAT, CNRS UMR 6508, 6 Bd du Maréchal JUIN 14050 CAEN Cedex, France 2 Department of Materials Engineering and Industrial Technologies, university of Trento, 38123 TRENTO, Italy

E-MRS 2012 Spring Meeting – Strasbourg Symposium X
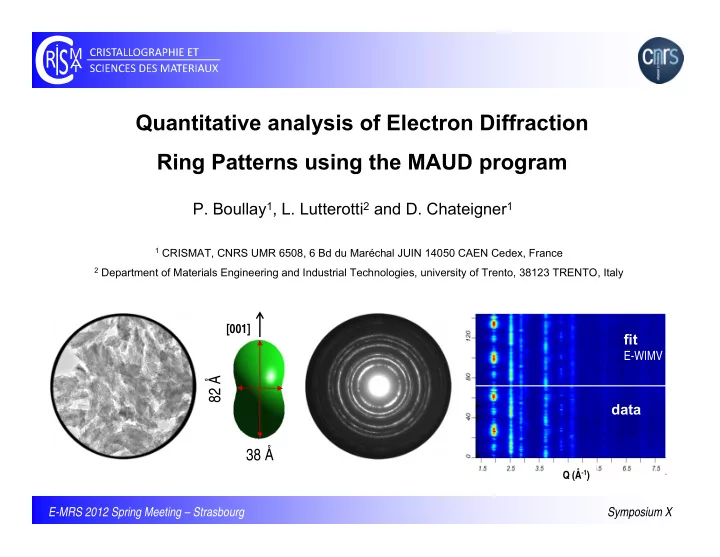
82 Å 38 Å

[001]

data fit

E-WIMV

Q (Å-1)

slide-2
SLIDE 2

E-MRS 2012 Spring Meeting – Symposium X

  • P. Boullay - CRISMAT Caen France

Outline

Quantitative analysis of electron diffraction ring patterns

Phase identification, structure and microstructure characterization with quantitative and reliable approaches of nanosized polycrystalline samples ?

Extraction of integrated intensities from electron diffraction ring patterns (ED-RP) for quantitative (or semi-quantitative) analysis …

Vainshtein (1964), … PCED 2.0 : X.Z. Li, Ultramicroscopy 110 (2010) 297-304 ProcessDiffraction : J.L. Labar, Microsc. Microanal. 15 (2009) 20-29 TextPat : P. Oleynikov, S. Hovmoller and X.D. Zou in Electron Crystallography The MAUD program : L. Lutterotti From the diffraction point of view !

slide-3
SLIDE 3

Size-Strain Texture Residual stresses

March-Dollase Harmonic (E)WIMV Standard Functions Geometric Voigt, Reuss, Hill Triaxial Stress Delft size-strain (PV) Popa anisotropic Size/Strain distributions Planar faulting (Warren) Turbostratic (Ufer) Evolutionary Simulated Annealing Marquardt (Least squares) Metadynamics optimization Simplex (Nelder-Mead) Genetic

X-ray Neutron Electron

Rietveld pattern fitting

MAUD

Indexing

(COD phase search procedure)

Peak location Peak fitting Structure refinement

  • L. Lutterotti

Nuclear Inst. and Methods in Physics Res. B268, 334-340, 2010.

http://www.ing.unitn.it/~maud/

E-MRS 2012 Spring Meeting – Symposium X

  • P. Boullay - CRISMAT Caen France

MAUD

Materials Analysis Using Diffraction

slide-4
SLIDE 4

MAUD

Materials Analysis Using Diffraction

E-MRS 2012 Spring Meeting – Symposium X

  • P. Boullay - CRISMAT Caen France

Tab panel to manage data sets, phases and sample. Plot panel, drag and drop a data file here to load a spectrum Full parameters list, to change the value, set refinable, fix or bound Output panel for the refinement process Toolbar to stop/resume/slow down computation Toolbar for common command shortcuts

download at http://www.ing.unitn.it/~maud/ The MAUD program is written in JAVA and can run on various platforms

slide-5
SLIDE 5

MAUD

Materials Analysis Using Diffraction

E-MRS 2012 Spring Meeting – Symposium X

  • P. Boullay - CRISMAT Caen France

Intensity extraction along the rings by segments using an ImageJ plugin

120 patterns

CAKING

chi=phi=0° / omega=90° / eta: 0° to 360°

Calibrate the distance specimen/detector ► mm to 2θ

pixel size ► pixels to mm

center position and correction for a small elliptical distortion are refinable parameters

rough estimation

  • f the center

position using a reference circle

  • n the screen
slide-6
SLIDE 6

MAUD

Materials Analysis Using Diffraction

E-MRS 2012 Spring Meeting – Symposium X

  • P. Boullay - CRISMAT Caen France

2θ (°) => Q (Å-1)

b(x): background => pic at 0° + polynomial function

peak location and intensities peak broadening vs. dhkl

1D XRPD-like pattern (360° summed intensity)

measured profile h(x) = f(x) ⊗ g(x) + b(x)

slide-7
SLIDE 7

Structure

Phase search and indexing

E-MRS 2012 Spring Meeting – Symposium X

  • P. Boullay - CRISMAT Caen France

Database Pattern Rietveld fit (for each phase in the database) Ranking Add new phases Best phase > threshold N End: Rietveld Y

The whole pattern representing the summed intensity along the rings can be used for an automatic phase search procedure in the Crystallography Open Database* using the program S_FPM (L. Lutterotti).

* S. Grazulis, D. Chateigner, R.T. Downs, A.F.T. Yokochi, M. Quirós, L. Lutterotti, E. Manakova, J. Butkus, P. Moeck and A. Le Bail, J. Appl. Crystallogr. 42, 726-729, 2009.

  • 1D XRPD-like experimental profile
  • list of elements (synthesis condition, EDX, EELS, …)
  • instrumental parameters (pixels to scattering angle, peak shape function, …)
slide-8
SLIDE 8

Structure

Phase search and indexing

E-MRS 2012 Spring Meeting – Symposium X

  • P. Boullay - CRISMAT Caen France

TiO2 rutile nanoparticules … see M. Reddy et al., ElectroChem. Com. 8 (2006) 1299-1303 for details

The pattern representing the summed intensity along the rings can be used for an automatic phase search procedure in the Crystallographic Open Database using the program S_FPM (L. Lutterotti).

Test on nanopowders (TiO2 rutile, Mn3O4 hausmannite, CoFe2O4 spinel) and textured thin films (MgO on Pt)

  • low texture : one single ED-RP is sufficient
  • strong texture : more tricky …need more than one ED-RP

Automatic indexing and phase ID is possible !

Kinematic approximation is used to calculate the whole pattern profile

Electron atomic scattering factors from the tables of L.M. Peng et al

slide-9
SLIDE 9

Microstructure

ED-RP vs XRPD

E-MRS 2012 Spring Meeting – Symposium X

  • P. Boullay - CRISMAT Caen France

h(x) = f(x) ⊗ g(x) + b(x)

sample contribution instrumental broadening

Extraction of f(x) can be obtained by a whole-pattern (Rietveld) analysis

Line broadening causes

  • instrumental broadening
  • finite size of the crystals (acts like a Fourier truncation: size broadening)
  • imperfection of the periodicity (due to dh variations inside crystals: microstrain effect)
  • generally: 0D, 1D, 2D, 3D defects

All quantities are average values over the probed volume ► electrons, x-rays, neutrons: complementary ► distributions: mean values depend on distributions’ shapes Need to know g(x) the instrumental broadening !

  • L. Lutterotti and P. Scardi, J. of Appl. Crystallogr. 23, 246-252 (1990)

The instrumental Peak Shape Function is obtained by analysing nanoparticules of known sizes and shapes as obtained from X-ray analyses

slide-10
SLIDE 10

Microstructure

ED-RP vs XRPD

E-MRS 2012 Spring Meeting – Symposium X

  • P. Boullay - CRISMAT Caen France

Mn3O4 hausmanite (L. Sicard - ITODYS - UMR 7086 CNRS / Univ. Paris 7)

Reflection mode

  • acq. time:3h30

> 100mg powder Transmission mode

  • acq. time:6h

powder in a capillary

Bruker D8 / Lynx Eye 1D λ=1.54056 Å (Cu Kα1)

Transmission mode

  • acq. time: few seconds!

very small amount of powder

TOPCON 2B / CCD ORIUS λ=0.0251Å

slide-11
SLIDE 11

Microstructure

ED-RP vs XRPD

E-MRS 2012 Spring Meeting – Symposium X

  • P. Boullay - CRISMAT Caen France

Mn3O4 hausmannite (L. Sicard et al, J. Magn. Magn. Mater. 322 (2010) 2634-2640)

Bruker D8 / Lynx Eye 1D λ=1.54056 Å (Cu Kα1) SG: I 41/a m d a=5.764(2)Å and c=9.448(4)Å TOPCON 2B / CCD ORIUS λ=0.0251Å a=5.7757(2)Å and c=9.4425(4)Å

53 Å 64 Å

pattern matching structure

POPA anisotropic shape g(x) ► f(x) f(x) ► g(x)

slide-12
SLIDE 12

Microstructure

Size and texture effects

E-MRS 2012 Spring Meeting – Symposium X

  • P. Boullay - CRISMAT Caen France

20nm

72 patterns

Microstructure of nanocrystalline materials: TiO2 rutile (1)

(1) M. Reddy et al., ElectroChem. Com. 8 (2006) 1299-1303

FEI Tecnai / CCD USC1000 / λ=0.0197Å

from phase search: TiO2 rutile P42/mnm a= 4.592Å a=2.957Å (COD database ID n°9001681)

slide-13
SLIDE 13

E-MRS 2012 Spring Meeting – Symposium X

  • P. Boullay - CRISMAT Caen France

RX ED-RP

average anisotropic crystallite size structure pattern matching

76 Å 82 Å 47 Å 38 Å

[001]

Microstructure

Size and texture effects

4-circles diffract. / INEL CPS λ= CuKα

slide-14
SLIDE 14

decreasing the selected area

0.5μm

E-MRS 2012 Spring Meeting – Symposium X

  • P. Boullay - CRISMAT Caen France

data fit

no texture

Q (Å-1)

6μm data fit

E-WIMV

Q (Å-1)

Texture :: intensity variation along the rings

Microstructure

Size and texture effects

local texture analysis

reconstructed pole figure (from the Orientation Distribution Function)

The features available in MAUD allow a full quantitative texture analysis for general cases (not only fiber textures!) from electron diffraction data with the

  • btention of accurate pole figures.

► application on textured thin film see M. Gemmi et al., J. Appl. Cryst. 44 (2011)

slide-15
SLIDE 15

E-MRS 2012 Spring Meeting – Symposium X

  • P. Boullay - CRISMAT Caen France

pattern matching structure – kinematic approximation

RX: a=4.583(1)Å c=2.949(1)Å x(O1)=y(O1)=0.3062(5) a=4.584(1)Å c=2.936(1)Å x(O1)=y(O1)=0.3006(2) Blackman 2-beams correction x(O1)=y(O1)=0.3064(2) RX 79 Å 47 Å 85 Å 39 Å 105 Å 27 Å a=4.571(1)Å c=2.938(1)Å

Microstructure

Pattern matching mode?

slide-16
SLIDE 16

E-MRS 2012 Spring Meeting – Symposium X

  • P. Boullay - CRISMAT Caen France

Conclusion

Quantitative analysis of electron diffraction ring patterns

Acknowledgments:

  • V. Pralong and V. Caignaert (TiO2 nanoparticules) @ CRISMAT – Caen
  • L. Sicard and S. Ammar (Mn3O4 nanoparticules) @ ITODYS – Paris 7
  • N. Ballot and S. Mercone (CoFe2O4 nanoparticules) @ LSPM – Paris 13
  • S. Gascoin (XRD measurements) @ CRISMAT – Caen

ANR FURNACE automatic phase search procedure (COD database, multi-phases) average lattice cell parameters and crystallite size (anisotropic shapes) accurate texture analysis (general cases, ODF, …) … can be obtained in the Pattern matching mode structure determination and refinement are possible within MAUD … would need some adaptation (2-beams and/or multi beams dynamical corrections) Quantitative analysis of nanosized polycrystalline samples using MAUD