
SLIDE 1
Quantification of methane emissions from oil and natural gas extraction regions in the Central/Western U.S. and comparison to previous studies
Jeff Peischl,1,2 Ken Aikin,1,2 Scott Eilerman,1,2 Jessica Gilman,1,2 Joost de Gouw,1,2 Scott Herndon,3 Brian Lerner,1,2 Andy Neuman,1,2 Travis Tokarek,4 Michael Trainer,2 Carsten Warneke,1,2 and Tom Ryerson2
1CIRES, University of Colorado Boulder, Boulder, CO, 2NOAA ESRL Chemical Sciences Division, Boulder, CO, 3Aerodyne Research, Inc., Billerica, MA, 4University of Calgary, Calgary, AB
- methane (CH4) is the second most important greenhouse gas after CO2
- many studies report inventories of CH4 are lower than top-down emissions estimates
- fast ethane (C2H6) data are key to apportioning CH4 emissions to specific sources
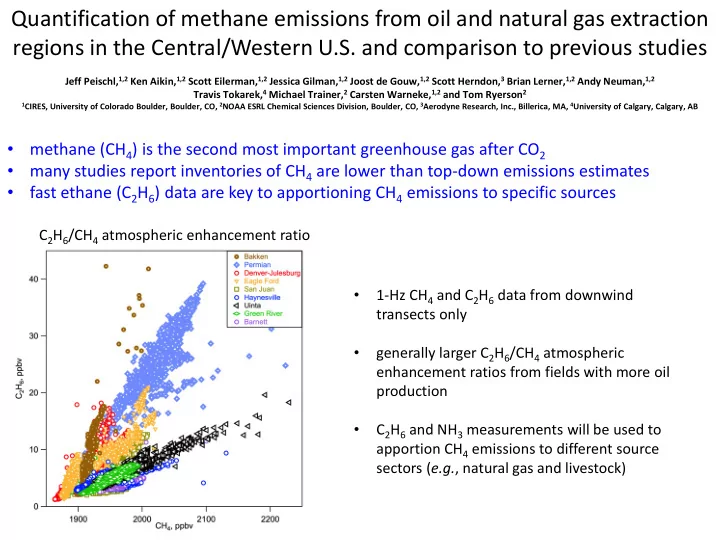
C2H6/CH4 atmospheric enhancement ratio
- 1-Hz CH4 and C2H6 data from downwind
transects only
- generally larger C2H6/CH4 atmospheric
enhancement ratios from fields with more oil production
- C2H6 and NH3 measurements will be used to