
SLIDE 1
Measuring Methane Emissions from Oil and Natural Gas Well Pads in - - PowerPoint PPT Presentation
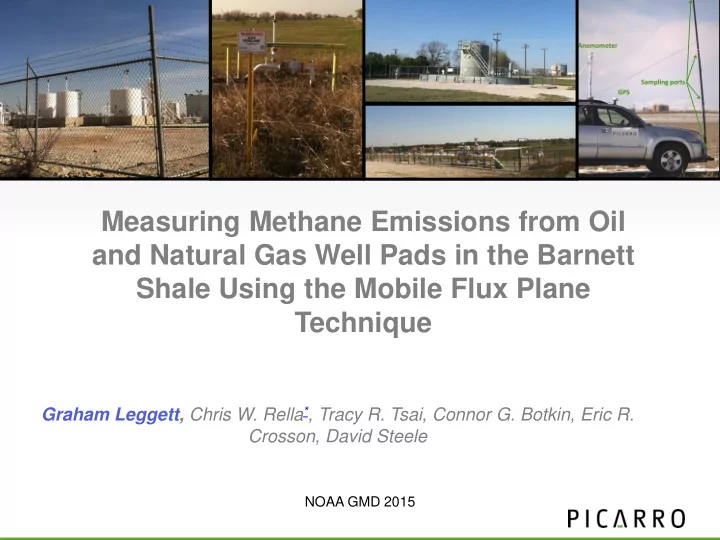
Measuring Methane Emissions from Oil and Natural Gas Well Pads in the Barnett Shale Using the Mobile Flux Plane Technique Graham Leggett, Chris W. Rella * , Tracy R. Tsai, Connor G. Botkin, Eric R. Crosson, David Steele NOAA GMD 2015 Methane
[1] Howarth, R. W., Santoro, R., & Ingraffea, A. (2011). Methane and the greenhouse-gas footprint of natural gas from shale formations. Climatic Change, 106(4), 679-690.
F A B C D E
monitoring inlet