
SLIDE 1
Quality of Experience
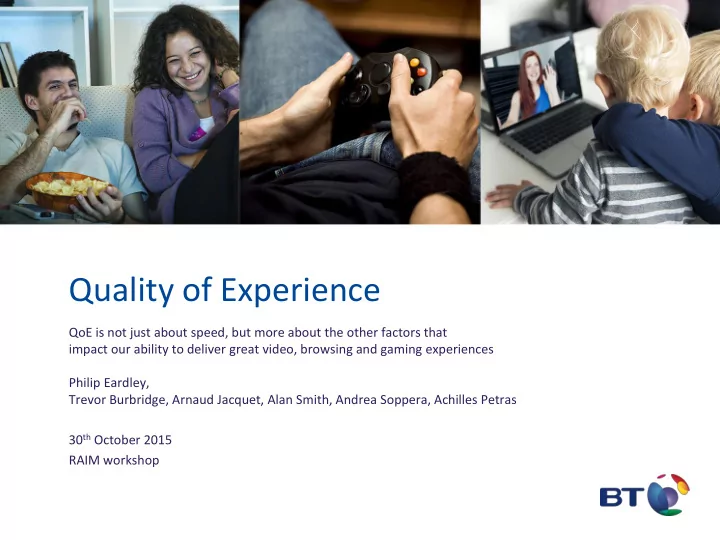
QoE is not just about speed, but more about the other factors that impact our ability to deliver great video, browsing and gaming experiences Philip Eardley, Trevor Burbridge, Arnaud Jacquet, Alan Smith, Andrea Soppera, Achilles Petras 30th October 2015 RAIM workshop