
SLIDE 1
Q2 FY2018 EARNINGS Q2 FY2018 Net Revenue of Rs. 3,421 mn; up 8.6% - - PowerPoint PPT Presentation
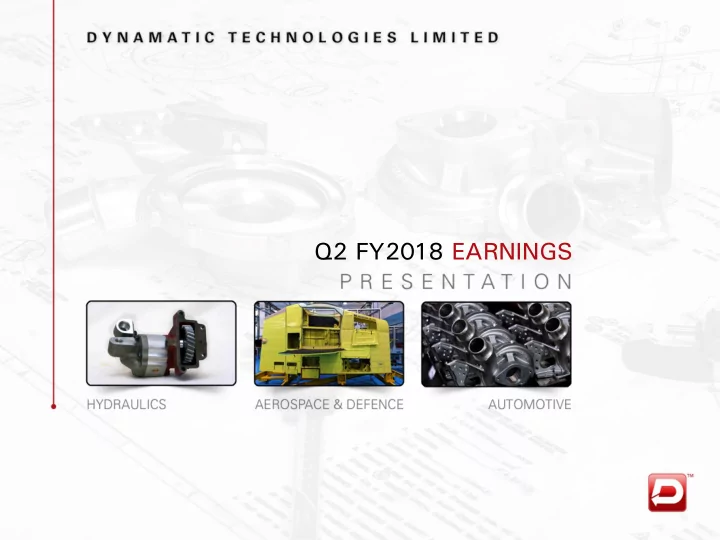
Q2 FY2018 EARNINGS Q2 FY2018 Net Revenue of Rs. 3,421 mn; up 8.6% from Rs. 3,148 mn in Q1 FY18 Q1 FY2018 Aerospace & Defence segment revenue of 26% o Rs. 898 mn; up 27.4% from Rs. 705 mn 22% last quarter 51% 57% 20% Hydraulics
57% 20% 22% 51% 23% 26%
Automotive Hydraulics Aerospace & Defence 3 Q2 FY2018 Q1 FY2018
4
5
Note: All Financials are Ind-AS based
Revenue 3,421 3,813 3,148 6,569 7,751 EBITDA 319 457 217 536 937 Profit After Tax (PAT) 13 100 (95) (82) 228 Basic EPS (Rs.) 2.05 15.79 (14.92) (12.87) 36.00 Total Comprehensive Income (Rs.) 50 79 (40) 10 124
6
EURO vs. INR 73.31 75.15 (1.84) 71.02 2.29 GBP vs. INR 83.34 92.02 (8.68) 82.47 0.88 USD vs. INR 64.37 66.95 (2.57) 64.46 (0.08) EURO GBP EURO Revenue (Rs. mn) (33.4) (64.2) (1.1) (132.9) EBITDA (Rs. mn) (1.2) (6.3) (1.1) (42.8)
7
projects and related employee expense led Q2 & 6M FY2018 EBITDA to decline on a y-o-y basis
for Airbus and Bell Helicopters continues at the new facility in Bangalore. Ramp up of phase 2 Airbus orders
expansion in the future
structure design and engineering.
India 68% UK 32% India 610 531 458 1,067 1,031 UK 288 302 247 535 649 India 174 216 102 276 421 UK 32 42 30 62 113
8
increased order offtakes. UK operations also performed well during Q2 FY2018. Also, for 6M FY2018, on a constant currency basis, revenue from UK increased marginally
American market
investment in the infrastructure sector. Started production of the new order in the UK; benefits to be realized during FY2018
systems
India 70% UK 30% India 556 481 446 1,002 924 UK 234 211 197 431 449 India 75 89 59 134 164 UK 31 7 (0) 30 24
9 Note: India – M: India – Machining India – F: India – Iron Foundry
next few quarters
Germany to drive both revenue and profitability in the coming year
components, customer diversification, steel castings & capacity utilization
India 20% Germany 80%
India – M 192 186 183
375 386
India – F 256 258 237
493 542
India – F: Inter Co.Settlement (104) (163) (97)
(201) (342)
Germany 1,388 2,022 1,478
2,866 4,131
India – M (34) (21) (29)
(63) (42)
India – F (8) 16 3
(5) 31
Germany 58 102 67
125 225
10
Note: Financials for Q1 FY18 & Q2 FY18 and Q2 FY17 are Ind-AS based
60% 55% 58% 57% 51% 18% 20% 19% 20% 23% 22% 25% 24% 22% 26% Q2 FY17 Q3 FY17 Q4 FY17 Q1 FY18 Q2 FY18 Automotive Hydraulics Aerospace & Defence 457 335 388 217 319 12.0% 9.5% 10.3% 6.9% 9.3% Q2 FY17 Q3 FY17 Q4 FY17 Q1 FY18 Q2 FY18 3,813 3,520 3,783 3,148 3,421 (3.2)% (7.7)% 7.5% (16.8)% 8.6% Q2 FY17 Q3 FY17 Q4 FY17 Q1 FY18 Q2 FY18
(Rs. million) Sept 30, 2017 June 30, 2017 Long Term Borrowings 4,913 5,099 Short Term Borrowings 2,084 1,798 Total Debt 6,997 6,897 Less: Cash & Cash Equivalents 419 319 Net Debt 6,577 6,579 Net Worth 3,350 3,325
Note: Interest Coverage ratio = Operating Profit / Interest Expense
11
166 177 195 182 180 1.9x 1.1x 1.2x 0.4x 0.9x Q2 FY17 Q3 FY17 Q4 FY17 Q1 FY18 Q2 FY18 1.8x 2.1x 2.1x 3.3x 4.7x 5.2x Q2 FY17 Q1 FY18 Q2 FY18 Debt/Equity Net Debt/LTM EBITDA
Competitive market position
turbochargers; leadership in hydraulic gear pumps market for over 35 years
structures and aerospace components. Tier I supplier to the global aerospace OEMs such as Airbus, Boeing, Bell Helicopters and HAL
performance critical components such as turbochargers and exhaust manifolds and has capabilities to develop automotive components on single-source basis
the automotive, hydraulic, aerospace and defense industries
selective acquisitions Diversified business
global auto OEM hub
Bristol, UK’s south west aerospace hub Locational advantages
12
R&D and Intellectual Property
India
captive use
manufacturing highly intricate castings
Bristol) and Germany (Schwarzenberg) Vertically Integrated Facilities Blue Chip Customers
Holland Fiat , Same Deutz-Fahr
Aerosystems
Board and Management
13
AUTOMOTIVE
50.6% of Q2 FY18 Revenue
automotive components including engine, transmission, turbocharger and chassis parts
aluminium castings HYDRAULICS
23.1% of Q2 FY18 Revenue
packages
AEROSPACE & DEFENCE
26.3% of Q2 FY18 Revenue
wing flaps and major airframe structures
14
Deere
Mahindra
Fiat
Fahr
Aerosystems
Shareholders Mar-17 Jun-17 Sep-17 Promoters 50.2% 50.2% 50.2% FIIs 14.7% 15.3% 14.8% DIIs 13.1% 12.4% 12.4% Others 22.0% 22.1% 22.6% Total 100.0% 100.0% 100.0%
Year Event Equity Capital (Rs. mn) 1974 Initial Public Offering 2.9 1987 Rights Issue 11.2 1992 Rights Issue 21.0 1994 Rights Issue 31.5 1995 Bonus Issue 41.9 2008 Amalgamation 48.1 2008 Qualified Institutional Placement 54.1 2014 Preferential convertible warrants 60.4 2014 Qualified Institutional Placement 63.4
15
Promoters 50.2% FIIs 14.8% DIIs 12.4% Others 22.6%
Net Sales / Income from Operations (Net of Excise Duty) 3,421 3,813 Other Operating Income Cost of Raw Materials Consumed 1,612 2,274 Changes in Inventories of Finished Goods, WIP and Stock in Trade 158 (163) Employee Benefit Expenses 599 557 Other Expenditure 732 688 Depreciation and Amortization Expenses 151 129 Other Income 13 22 Finance Costs 180 166 Exceptional (Gain)/ Losses Tax Expenses (12) 84 Basic EPS (Rs) 2.05 15.79 Gross Margins EBITDA margins PAT margins Total Revenues EBITDA PAT
16
Goodwill 907 Fixed Assets 7,139 Non-Current Investment 17 Deferred tax asset (net) Long Term Loans and Advances 156 Other Non Current Assets 42 Inventories 2,659 Trade Receivables / Sundry Debtors 1,779 Cash and Cash Equivalents 256 Bank Balance Other than Cash 164 Other Financial Assets 1 Short-Term Loans and Advances 216 Income Tax Assets (net) 12 Other Current Assets 752
17
Share capital 63 Reserves and surplus 3,286 Money Received against Share Warrants Non-controlling interest (Preference capital) Long-Term Borrowings 4,489 Deferred Tax Liabilities (net) 89 Other Long Term Liabilities 16 Long Term Provisions 125 Short-Term Borrowings 2,084 Trade Payables 2,503 Other Financial Liabilities 932 Other Current Liabilities 374 Income Tax Liabilities (net) 66 Short-Term Provisions 72
18
19
20