Q1 January March Development in company portfolio Sales growth of - - PDF document

q1
SMART_READER_LITE
LIVE PREVIEW

Q1 January March Development in company portfolio Sales growth of - - PDF document

Interim report 2016 Q1 January March Development in company portfolio Sales growth of +5% Weak earnings trend, adjusted EBITA -14% and EBITA -27%, in line with expectations Acquisitions and divestments Acquisition of Danish


slide-1
SLIDE 1

1 January – March Interim report 2016

Development in company portfolio

■ Sales growth of +5% ■ Weak earnings trend, adjusted EBITA -14% and EBITA -27%, in line with expectations

Acquisitions and divestments

■ Acquisition of Danish ventilation company airteam ■ Acquisition of Finnish real estate company Serena Properties completed in January

Financial information

■ Profit/share of profits from companies SEK 14m (160), a decline mainly due to changed company portfolio ■ Loss before tax SEK -25m (+91) ■ Earnings per share before dilution SEK -0.18 (-0.14) ■ Continued strong financial position ■ Total return on Ratos share +7%

Interim report 2016 January – March

Q1

Ratos’s results in summary

SEKm 2016 Q 1 2015 Q 1 2015

Profit/share of profits 14 160 664 Exit gains 1,101 Impairment

  • 565

Profit from companies 14 160 1,200 Income and expenses in the parent company and central companies

  • 39
  • 69
  • 308

Profit before tax

  • 25

91 892

slide-2
SLIDE 2

2 January – March Interim report 2016

■ In January, the acquisition of Serena Properties – a newly formed real estate company with a portfolio of 22 com- mercial retail properties in Finland – was completed. The purchase price (enterprise value) for 100% of the company amounted to EUR 191.5m, of which Ratos paid EUR 39m (SEK 359m) and owns 56% ■ In February, an agreement was signed to acquire 70% of the shares in airteam, a leading supplier of ventilation solutions in Denmark. The purchase price (enterprise value) for 100%

  • f the company amounted to DKK 575m, of which Ratos

provided DKK 272m. The transaction was completed in April ■ At Ratos’s 2016 Annual General Meeting held on 14 April, Jonas Wiström was elected new Chairman of the Board of Ratos and Ulla Litzén new member of the Board. Resolution

  • n dividends of SEK 3.25 per ordinary share, making a total
  • f SEK 1,037m

■ Ratos has provided at total of SEK 120m to Euromaint in conjunction with a new financing agreement

Important events

Events after the end of the period

■ Capital contribution of EUR 5m to GS-Hydro ■ Additional purchase price of EUR 4m paid for TFS More information about important events in the companies is provided on pages 5-13.

On page 13, an extensive table is provided with financial information for Ratos’s companies to facili- tate analysis. At www.ratos.se, income statements, statements of financial position, etc., for all Ratos’s companies are available in downloadable Excel files.

1) Comparison with corresponding period preceding year and for comparable units. 2) Excluding items affecting comparability.

Performance Ratos’s companies 1)

2016 Q 1

100% Ratos’s share Sales +5% +5% EBITA

  • 29%
  • 27%

Adjusted EBITA 2)

  • 13%
  • 14%
slide-3
SLIDE 3

3 January – March Interim report 2016

Despite some global economic and stock market tur- bulence during the first quarter, the market situation for Ratos’s companies remains generally unchanged. Ratos’s portfolio has changed considerably over the past years as we have increased the proportion

  • f growth companies, completed several exits and

continue to maintain a rapid pace in value-creating improvement initiatives. The start of 2016 showed positive sales growth of 5% as an effect of completed growth initiatives. However, the adjusted EBITA weak- ened 14% during the quarter in line with the expected very sluggish start of the year, mainly for GS-Hydro and Euromaint. Historically, the first quarter is the smallest for Ratos’s companies in terms of earnings and our cautiously positive view for the full year is

  • unchanged. We pursue our day-to-day activities with

clear change agendas and intense transaction focus.

Varied market situation

The general macroeconomic situation is still stable, but with vast differences between the different geographies, industries and niches. Ratos’s companies are primarily exposed to the Nordic countries where trends are stable overall, even if there are considerable differences between the countries. We also see currency movements, mainly NOK against SEK, which has a negative impact on Ratos. A few of Ratos’s companies have sales in China, and here we have seen a distinct slowdown even if, due to its limited size for Ratos, this has no major impact on the whole. For us, the market situation means continued focus

  • n investing in niches with underlying structural growth and in

companies that have potential to grow.

Focus on value-creating initiatives

In the current market climate, it is even more important that all companies constantly identify and realise growth potential and implement efficiency programmes to increase in value. Many of our companies are making progress both operation- ally and strategically, where our objective is to combine long-term value creation with a high pace of change. Because the companies are in different phases of their development, their agendas differ. Some companies are adapting to the

Growth and weak earnings trend in line with expectations

currently tough market conditions and others implement signifi- cant strategic growth initiatives. The oil service company Aibel has a strong order book, while extensive restructuring measures are being carried out to strengthen its long-term competitiveness. Data and analytics company Bisnode is upping the pace and launching an extensive change programme to exploit the growing demand in data and analysis, which entails organisation changes, product develop- ment and more effective processes. The wine and spirits provider ArcusGruppen is increasing its production efficiency through higher volumes in the new production plant outside Oslo and DIAB is investing in a new factory for composite ma- terial in China. The Norwegian construction company HENT has recently established a presence in Sweden and KVD, an

  • nline marketplace for second-hand vehicles, is implementing

significant IT initiatives in order to further enhance its customer

  • ffering over time. These are all examples of ventures aimed at

value creation in the future, something that we as committed

  • wners want to support the companies in doing.

The first quarter shows a positive sales growth of 5% but a weakened operating result of -14%. The negative earnings trend is mainly due to a predicted, sluggish start of the year although the weakening of NOK against SEK also has a negative

  • impact. Many of Ratos’s companies continue to show healthy

CEO comments on performance in the first quarter

slide-4
SLIDE 4

4 January – March Interim report 2016

Susanna Campbell See the video at www.ratos.se where CEO Susanna Campbell comments on performance in the first quarter. growth in both sales and earnings. It is satisfying to note that

  • ur medium-sized companies combined show net sales growth
  • f 11% and a 14% increase in adjusted EBITA, which is an effect
  • f earlier implemented growth and streamlining initiatives. We

see a weak earnings trend – mainly in GS-Hydro, and in Aibel to a certain extent, both of which are exposed to the offshore markets but also in Euromaint, a maintenance company for the rail transport industry, which last year concluded individual contracts in a fiercely competitive market. In these situations, it is important as owner to work with the Board and manage- ment to take the necessary measures to ensure long-term competitiveness.

Hesitant start for the transaction markets

The transaction market opened with a hesitant start to the year given the extremely weak performance on the stock exchange. As stock market concerns ebbed, activity has picked up and the transaction market is now deemed to be strong. Access to capital is still good with many investors looking for returns and industrial buyers who want to acquire to generate growth. Above all, Ratos looks for companies with favourable develop- ment potential where our unique profile, flexible ownership horizon and clear investment strategy are considered attractive. During the quarter, we signed an agreement for the acquisition

  • f the majority of Danish company airteam, a leading supplier
  • f ventilation solutions. This is yet another example of a part-

nership situation where the company actively sought a dedicat- ed owner with whom it could develop the company, and where Ratos’s expertise in operational develop ment and strong value foundation have been extremely important factors.

Unchanged view of 2016

Our cautious macroeconomic view for the full-year 2016 re- mains unchanged and we predict that the market situation will continue to vary. The transaction market is expected to remain strong, which provides both opportunities and challenges. As expected, the first-quarter earnings trend for the Ratos port- folio was weak and our cautiously positive view for the full year is unchanged. Ratos does, however, have a portfolio composi- tion that changes over time.

slide-5
SLIDE 5

5 January – March Interim report 2016

Companies overview

Ratos invests mainly in unlisted medium-sized Nordic companies and has 19 companies in its portfolio, including the acquisition of airteam, completed after the close of the quarter. The largest segments in terms of sales are Construction, Industrials and Consumer goods/Commerce. On 31 March 2016, ten portfolio companies are categorised as medium-sized (mid cap) and eight as small-sized (small cap). A detailed description of each company is presented below.

Consumer goods/Commerce 18% ArcusGruppen, Jøtul, HL Display Business service 9% Euromaint, Speed Group Healthcare/Life Science 3% Biolin Scientific, TFS Technology, Media, Telecom 13% Bisnode, KVD, Nebula Sales breakdown by segment *

* Adjusted for the size of Ratos’s holding. Excluding airteam which is included in the Group’s sales as of the interim report for the January – June 2016 period.

Industrials 18% DIAB, Mobile Climate Control, Ledil, GS-Hydro

FINLAND

4

COMPANIES SWEDEN

9

COMPANIES NORWAY

4

COMPANIES DENMARK

2

COMPANIES

19

*

16,000

companies with approximately employees

Energy 13% Aibel, AH Industries Real estate 1% Serena Properties Construction 25% HENT

Medium-sized companies

In total, the companies in this segment show an 11% growth in net sales during the quarter, and an increase in adjusted EBITA of 14%. Total sales for the medium-sized companies account for 77% of Ratos’s portfolio and 96% of adjusted EBITA.

Net sales trend

(Local currency)

Adjusted EBITA margin

D I A B M

  • b

i l e C l i m a t e C

  • n

t r

  • l

L e d i l H E N T N e b u l a K V D A r c u s G r u p p e n B i s n

  • d

e H L D i s p l a y A i b e l

  • 10

10 20 30 40 50 60 % DIAB Mobile Climate Control Ledil HENT Nebula KVD ArcusGruppen Bisnode HL Display Aibel

  • 5

5 10 15 20 25 30 35 40 2015 2016 % * Including the acquisition of airteam completed in April 2016. The number of employees is based

  • n the average number of employees on 31 December 2015 for the 19 companies.
slide-6
SLIDE 6

6 January – March Interim report 2016

Aibel

■ Sales increased 6% year-on-year, driven by high activity in Field Development, mainly related to new construction contracts for the Johan Sverdrup field. Continued weak market trend and low MMO and Modification activity levels ■ Continued good delivery in terms of the project portfolio, but weakened operating margin as an effect of strong comparative figures in the first quarter of 2015 when a number of projects in the final phase of completion enhanced earnings ■ Due to continued market uncertainty, the lost maintenance contract for the Ekofisk oil field and to reinforce competi- tiveness, new efficiency programmes have been initiated that will involve further layoffs. Earnings were charged with costs affecting comparability related to further modifica- tions to the current level of activity ■ The order book at 31 March 2016 amounted to approxi- mately NOK 18.5 billion (approximately NOK 19 billion in the year-earlier period)

NOKm Q 1 2016 Q 1 2015

Holding

32%

Sales 1,883 1,776 EBITA 65 117 Adjusted EBITA 114 131 Adjusted EBITA margin 6.0% 7.4% Time of acquisition, year 2013 Book value (SEKm) 1,559

Aibel is a leading Norwegian supplier of maintenance and modification services (MMO and Modification) for oil and gas production platforms as well as new construction projects (Field Development) within oil, gas and renewable energy. The com- pany has operations along the entire Norwegian coast as well as in Asia. Customers are primarily major oil companies which

  • perate on the Norwegian continental shelf.

NOKm Q 1 2016 Q 1 2015

Holding

83%

Sales 533 498 EBITA 10

  • 14

Adjusted EBITA 10

  • 13

Adjusted EBITA margin 1.9%

  • 2.6%

Time of acquisition, year 2005 Book value (SEKm) 684

ArcusGruppen

■ Good sales growth of 7%, primarily driven by increased demand within wines in Sweden and the acquisition of Social Wines in Finland. Stable trend within spirits, particu- larly in the aquavit segment ■ Improved operating profit due to higher volumes and lower production costs following the relocation of production from Aalborg to Gjelleråsen. Continued earnings improve- ment within distribution operations (operating loss NOK -12m (-17)) ■ Minority shares in two of the company’s current wine agencies were acquired during the quarter. In total, this represents an investment of approximately NOK 60m for ArcusGruppen ArcusGruppen is a leading supplier of wine and spirits in the Nordic region through its own brands and leading agencies. The company’s best known proprietary spirits brands include Aalborg Akvavit, Lysholm Linie Aquavit, Braastad Cognac and Gammel

  • Dansk. In wines, ArcusGruppen has both its own brands and

agency operations through, for example, Vingruppen.

slide-7
SLIDE 7

7 January – March Interim report 2016 SEKm Q 1 2016 Q 1 2015

Holding

70%

Sales 856 873 EBITA

  • 16

38 Adjusted EBITA 28 49 Adjusted EBITA margin 3.3% 5.7% Time of acquisition, year 2004 Book value (SEKm) 1,248

Bisnode

■ Organic revenue development adjusted for currency effects amounted to -2%, due to strategic measures in the form of product rationalisation and subsequently lower volumes in

  • Sweden. Otherwise, stable underlying sales trend

■ Weak earnings trend due to increasing costs in conjunction with the ongoing change initiatives and higher data costs ■ During the quarter, the extensive change initiatives to strengthen core operations and modernise the customer

  • ffering accelerated. Non-recurring costs amount to

SEK 44m (12) and are mainly due to such factors as the restructuring process, which involves layoffs. To meet the growing demand for Data & Analytics, further strategic initiatives are planned to strengthen the organisation, develop the offering and create profitable growth Bisnode is a leading European provider of decision support within business, credit and market information. The customer base is companies and organisations in Europe which use Bisnode’s services to convert data into knowledge for both day-to-day issues and major strategic decisions.

SEKm Q 1 2016 Q 1 2015

Holding

96%

Sales 360 369 EBITA 21 37 Adjusted EBITA 26 37 Adjusted EBITA margin 7.1% 10.0% Time of acquisition, year 2001/2009 Book value (SEKm) 658

DIAB

■ Sales on par with last year adjusted for currency effects, with continued strong trend in the TIA segment and stable trend in the Wind segment. Continued downturn in demand in China was noted during the quarter, also within the Marine segment ■ Adjusted for currency effects, the operating profit (adjusted EBITA) is unchanged. Profit was charged with costs for establishing a new factory in China ■ Growth initiatives in China in the form of the establishment

  • f a new IPN foam production facility in China is proceed-

ing according to plan and the factory is expected to start

  • perations at the end of the first half of 2016

DIAB is a global company that develops, manufactures and sells core materials for sandwich composite structures including blades for wind turbines, hulls and decks for leisure boats, and compo- nents for aircraft, trains, industrial applications and buildings. The core materials have a unique combination of characteristics such as low weight, high strength, insulation properties and chemical resistance.

NOKm Q 1 2016 Q 1 2015

Holding

73%

Sales 1,871 1,196 EBITA 70 48 Adjusted EBITA 71 48 Adjusted EBITA margin 3.8% 4.0% Time of acquisition, year 2013 Book value (SEKm) 220

HENT

■ Excellent sales growth of 56% driven by a strong order book and good progress in ongoing projects ■ Healthy profitability driven by effective implementation of projects in progress ■ During the quarter, HENT set up an office in Stockholm to start long-term marketing activities in Sweden ■ Order intake of approximately NOK 1.4 billion with several new projects, primarily in the public sector. The

  • rder book at 31 March 2016 amounted to approximately

NOK 8.2 billion (approximately NOK 8.7 billion at 31 March 2015) HENT is a leading Norwegian construction company with projects throughout the country, primarily newbuild public and commercial real estate. The company focuses on project devel-

  • pment, project management and procurement. The projects

are to a large extent carried out by a broad network of quality assured subcontractors.

slide-8
SLIDE 8

8 January – March Interim report 2016 SEKm Q 1 2016 Q 1 2015

Holding

99%

Sales 349 337 EBITA 18

  • 11

Adjusted EBITA 18 1 Adjusted EBITA margin 5.2% 0.3% Time of acquisition, year 2001/2010 Book value (SEKm) 802

HL Display

■ Positive sales trend due to modifications of the sales strategy and higher demand in the grocery retailer sector, primarily in the UK, France and the Nordic countries ■ Strong profitability driven by increasing volumes, high capacity in production and previously implemented restructuring measures ■ Continued focus on new sales initiatives and streamlining

  • f production

■ Nina Jönsson assumed the position of CEO on 1 March 2016 HL Display is a global supplier of products and systems for merchandising and in-store communication with operations in 47 countries. Manufacture takes place in Poland, Sweden, China and the UK.

EURm Q 1 2016 Q 1 2015

Holding

66%

Sales 9.3 7.5 EBITA 3.0 2.4 Adjusted EBITA 3.0 2.4 Adjusted EBITA margin 31.9% 32.4% Time of acquisition, year 2014 Book value (SEKm) 481

Ledil

■ Strong sales growth of 25%, primarily driven by higher demand in all large markets ■ Increased operating profit due to higher volumes ■ Several strategic growth initiatives have started, primarily in sales and product development and through the estab- lishment of new sales organisations in North America Ledil is a Finnish leading global player within secondary optics for LED lighting. The products are sold by the company’s own sales force as well as via agents and distributors in Europe, North America and Asia. Production is carried out by subcon- tractors in Finland and China.

SEKm Q 1 2016 Q 1 2015

Holding

100%

Sales 78 76 EBITA 5 8 Adjusted EBITA 9 9 Adjusted EBITA margin 11.9% 12.5% Time of acquisition, year 2010 Book value (SEKm) 317

KVD

■ Strong sales trend driven by favourable growth within Private Cars (+32%) and stable performance in Company Cars and in Machines & Heavy Vehicles ■ Adjusted EBITA on par with last year due to continued investments in IT and development of services ■ Investment in the valuation service in Norway and decision taken to discontinue the unprofitable Norwegian auction operations. The close-down costs are charged to the reported first quarter earnings ■ Torbjörn Wik assumed the position of CEO in January 2016 KVD is Sweden’s largest independent online marketplace

  • ffering broker services for second-hand vehicles. The company
  • perates the auction sites kvd.se, kvdnorge.no, kvdpro.com and

kvdauctions.com, where cars, heavy vehicles and machines are

  • ffered for sale at weekly online auctions. The number of unique

visitors totals approximately 200,000 per week. The company includes valuation portals for cars.

slide-9
SLIDE 9

9 January – March Interim report 2016 SEKm Q 1 2016 Q 1 2015

Holding

100%

Sales 321 290 EBITA 35 29 Adjusted EBITA 35 30 Adjusted EBITA margin 10.9% 10.4% Time of acquisition, year 2007/2008 Book value (SEKm) 1,045

EURm Q 1 2016 Q 1 2015

Holding

73%

Sales 8.9 7.1 EBITA 3.0 1.9 Adjusted EBITA 3.0 1.9 Adjusted EBITA margin 34.2% 27.4% Time of acquisition, year 2013 Book value (SEKm) 246

Nebula

■ Strong sales growth of +25% driven by higher demand in all service areas and the acquisition of Telecity ■ Improved profitability as an effect of increasing sales and previously implemented sales and product development initiatives ■ New initiatives for sales, customer loyalty and customer service to strengthen competitiveness Nebula is a market leading provider of cloud-based services, IT-managed services and network services to small and medium- sized enterprises in the Finnish market. The company has two data centres in Finland as well as its own leased fibre network between the largest cities in Finland. Nebula has a total of about 40,000 customers. 90% of sales are subscription based.

Mobile Climate Control (MCC)

■ Good sales growth of +11% (+15% adjusted for currency effects) with continued good market activity and strength- ened position in the bus segment in North America ■ Improved profitability driven by increasing sales and implemented measures ■ Continued focus on growth initiative through greater market presence, product innovation and establishment

  • f new production plant

Mobile Climate Control offers complete climate comfort systems for three main customer segments: buses, off road and defence

  • vehicles. Approximately 80% of the company’s sales take place

in North America and approximately 20% in Europe. Major pro- duction plants are located in Canada (Toronto), USA (Goshen) and Poland (Olawa).

slide-10
SLIDE 10

10 January – March Interim report 2016 SEKm Q 1 2016 Q 1 2015

Holding

100%

Sales 44 52 Adjusted EBITA

  • 6
  • 1

Time of acquisition, year 2010 Book value (SEKm) 351

Small-sized companies

In total, the companies in this segment show a negative trend of -11% in net sales and a decrease in adjusted EBITA of -87%. Total sales for the small-sized companies account for 23% of Ratos’s portfolio and 4% of adjusted EBITA.

Net sales trend

(Local currency)

Speed Group T F S A H I n d u s t r i e s B i

  • l

i n S c i e n t i f i c J ø t u l E u r

  • m

a i n t S e r e n a P r

  • p

e r t i e s G S

  • H

y d r

  • 30
  • 20
  • 10

10 20 30 % Speed Group TFS AH Industries Biolin Scientific Jøtul Euromaint Serena Properties GS-Hydro 2015 2016 %

  • 15
  • 10
  • 5

5 10 75 80

AH Industries

■ Lower sales, due in part to internal production disruptions within Manufacturing Solutions ■ Continued focus on improvement measures. Implemented sales initiatives resulted in a positive trend in order intake during the quarter

Biolin Scientific

■ Negative sales trend of -16% year-on-year, which has affected the profit negatively. During the quarter, the new product Q-Sense Initiator was launched within Analytical Instruments, which is expected to contribute favourably in the long term ■ Christina Rubenhag assumed the position of CEO in March

DKKm Q 1 2016 Q 1 2015

Holding

70%

Sales 179 190 Adjusted EBITA

  • 5

7 Time of acquisition, year 2007 Book value (SEKm) 118

AH Industries is a leading supplier of metal components, modules, systems and services to the wind energy, cement and minerals industries. Biolin Scientific develops, manufactures and markets analytical instruments for research, development and quality control. The company’s largest market niche is nanotechnology, primarily materials science, cell analysis and biophysics. Adjusted EBITA margin

slide-11
SLIDE 11

11 January – March Interim report 2016 EURm Q 1 2016 Q 1 2015

Holding

100%

Sales 25.4 34.1 Adjusted EBITA

  • 2.4

1.1 Time of acquisition, year 2001 Book value (SEKm) 146

Euromaint

■ As expected, the trend during the quarter was weak due to lower volumes in concluded contracts and strong comparative figures in the first quarter of 2015. Efficiency programmes are progressing according to plan ■ Ratos provided a total of SEK 120m when Euromaint signed a new financing agreement in February. The new Group structure following the divestment of the German opera- tions will now have a new optimum capital structure and improved cash flow

GS-Hydro

■ Negative sales trend driven by weak offshore market and lower demand in the land-based customer segment. Negative earnings due to low volumes, over capacity and increasing costs in a single large project ■ Global restructuring programme initiated with focus on efficiency and further cost savings. Capital contribution of EUR 5m after the end of the period

SEKm Q 1 2016 Q 1 2015

Holding

100%

Sales 404 478 Adjusted EBITA 20 46 Time of acquisition, year 2007 Book value (SEKm) 185

Euromaint is Sweden’s leading independent maintenance company for the rail transport industry. GS-Hydro is a leading global supplier of non-welded piping solutions.

Jøtul

■ Sales increased by 5% (-2% adjusted for currency effects) driven by increasing demand in Norway. Improved profit- ability due to previously implemented restructuring and efficiency improvement measures

NOKm Q 1 2016 Q 1 2015

Holding

93%

Sales 203 194 Adjusted EBITA

  • 9
  • 12

Time of acquisition, year 2006 Book value (SEKm) 89

.

The Norwegian company Jøtul is a global supplier of stoves and fireplaces with its main production facilities in Norway and Denmark.

slide-12
SLIDE 12

12 January – March Interim report 2016 SEKm Q 1 2016 Q 1 2015

Holding

70%

Sales 141 114 Adjusted EBITA 11 13 Time of acquisition, year 2015 Book value (SEKm) 295

Serena Properties

■ Stable trend in terms of rental income and profitability ■ The acquisition was completed in January. Active manage- ment of the real estate portfolio initiated with focus on developing the respective retail areas and establishing the company’s governance

Speed Group

■ Strong sales growth of 24% driven by higher demand in both logistics and staffing services. Lower operating margin due to investment in new IT platform and increasing personnel costs

SEKm Q 1 2016 Q 1 2015

Holding

56%

Sales 42 42 Adjusted EBITA 33 33 Time of acquisition, year 2016 Book value (SEKm) 362

Serena Properties is a newly formed real estate company with a portfolio of 22 commercial retail properties in 14 mid-sized towns in Finland. Speed Group is a fast-growing Swedish supplier of services that extend from staffing and recruitment to full-scale warehouse management, and production and education.

TFS

■ Service sales amounted to EUR 15.1m (12.4), correspond- ing to growth of 22%. Continued strong order book with several new agreements for global clinical trials ■ Initiatives to boost sales, strengthen the organisation and increase internal efficiency initiated to strengthen competitiveness ■ Additional purchase price of EUR 4m paid after the end

  • f the period

EURm Q 1 2016 Q 1 2015

Holding

60%

Sales 18.3 15.5 Adjusted EBITA 1.0 1.0 Time of acquisition, year 2015 Book value (SEKm) 138

TFS performs clinical trials in the human phase on behalf

  • f the pharmaceutical, biotechnology and medical device

industries.

slide-13
SLIDE 13

13 January – March Interim report 2016

A) EBITA, adjusted for items affecting comparability. B) Investments excluding business combinations. C) Cash flow from operating activities and investing activities before acqui-

sition and disposal of companies. All figures in the above table relate to 100% of each company, except consolidated value, which is based on Ratos’s holding. To facilitate comparisons between years and provide a comparable structure, where appropriate some companies are reported pro forma. Pro formas for 2016 are presented in the note to the right. Complete income statement, state- ment of financial position and statement of cash flows for all companies is available at www.ratos.se.

1) Earnings for 2016 and 2015 are pro forma taking into account Ratos´s

acquisition, new financing and a new group structure. Pro forma con- sists of actual outcomes under previous group structure adjusted for estimations related to new financing and group structure.

Net sales EBITA Adjusted EBITA

A)

SEKm 2016 Q 1 2015 Q 1 2015 2016 Q 1 2015 Q 1 2015 2016 Q 1 2015 Q 1 2015

AH Industries 223 239 929

  • 7

9 15

  • 7

9 8 Aibel 1,844 1,907 7,728 63 125 279 111 140 480 ArcusGruppen 521 535 2,586 9

  • 15

218 10

  • 14

239 Biolin Scientific 44 52 227

  • 9
  • 2

8

  • 6
  • 1

10 Bisnode 856 873 3,535

  • 16

38 280 28 49 332 DIAB 360 369 1,450 21 37 154 26 37 146 Euromaint 404 478 1,735 20 46 74 20 46 87 GS-Hydro 236 320 1,175

  • 24

8 12

  • 22

10 26 HENT 1,832 1,284 5,716 69 52 189 69 52 190 HL Display 349 337 1,488 18

  • 11

8 18 1 66 Jøtul 199 209 930

  • 10
  • 15
  • 9
  • 13

6 KVD 78 76 317 5 8 29 9 9 38 Ledil 87 70 297 28 23 95 28 23 95 Mobile Climate Control 321 290 1,264 35 29 152 35 30 154 Nebula 83 66 299 28 18 87 28 18 90 Serena Properties 1) 42 42 167 33 33 133 33 33 133 Speed Group 141 114 536 11 11 25 11 13 42 TFS 170 145 689 10 9 45 10 9 45 T

  • tal 100%

7,791 7,407 31,068 284 402 1,802 392 451 2,188 Change 5%

  • 29%
  • 13%

T

  • tal adjusted for

holding 5,407 5,143 21,620 189 257 1,288 250 291 1,513 Change 5%

  • 27%
  • 14%

Interest-bearing Consolidated Ratos’s Depreciation Investments B) Cash flow C) net debt value holding SEKm 2016 Q 1 2016 Q 1 2016 Q 1 31 March 2016 31 March 2016 31 March 2016

AH Industries 9 2

  • 24

314 118 70 Aibel 27 21

  • 19

4,015 1,559 32 ArcusGruppen 11 4

  • 129

1,228 684 83 Biolin Scientific 4 4 9 126 351 100 Bisnode 29 35 19 1,906 1,248 70 DIAB 17 48

  • 74

864 658 96 Euromaint 8 1

  • 7

457 185 100 GS-Hydro 6 4

  • 44

397 146 100 HENT 2 2 281

  • 762

220 73 HL Display 8 5

  • 25

640 802 99 Jøtul 12 9

  • 24

491 89 93 KVD 4 1 8 158 317 100 Ledil 15 164 481 66 Mobile Climate Control 3 3

  • 24

429 1,045 100 Nebula 5 5 28 468 246 73 Serena Properties 1) 1,807

  • 1,771

1,123 362 56 Speed Group 2 2 85

  • 43

295 70 TFS 1 2 5

  • 31

138 60

Ratos’s companies at 31 March 2016

slide-14
SLIDE 14

14 January – March Interim report 2016

Financial information

Ratos’s results

Loss before tax for the first quarter of 2016 amounted to SEK -25m (91). The lower reported earnings are primarily due to a modified company portfolio following the divestment

  • f, among others, Nordic Cinema Group in 2015. The result

includes profit/share of profits from the companies in the amount of SEK 14m (160).

Income and expenses in the parent company and central companies

Ratos’s central income and expenses amounted to SEK -39m (-69), consisting of management costs of SEK -51m (-66) and net financial items of SEK 12m (-3).

SEKm 2016 Q 1 2015 Q 1 2015 Profit/share of profits before tax 1) AH Industries (70%)

  • 11
  • 6
  • 15

Aibel (32%)

  • 38
  • 8
  • 75

ArcusGruppen (83%)

  • 15
  • 26

106 Biolin Scientific (100%)

  • 11
  • 4

3 Bisnode (70%)

  • 71

201 DIAB (96%) 10 28 105 Euromaint (100%) 1

  • 224

GS-Hydro (100%)

  • 27

4 11 Hafa Bathroom Group (100%) 2) 2 3 HENT (73%) 64 48 194 HL Display (99%) 14

  • 22
  • 28

Inwido (10%) 3) 7 42 Jøtul (93%)

  • 6
  • 32
  • 42

KVD (100%) 4 6 21 Ledil (66%) 28 8 65 Mobile Climate Control (100%) 32 5 108 Nebula (73%) 20 14 71 Nordic Cinema Group (58%) 4) 136 108 Serena Properties (56%) 5) 3 Speed Group (70%) 6) 10 10 TFS (60%) 7) 6

  • 2

T

  • tal profit/share of profits

14 160 664 Exit Nordic Cinema Group 905 Exit Inwido 290 Exit Hafa Bathroom Group

  • 93

T

  • tal exit result

1,101 Impairment AH Industries

  • 85

Impairment Euromaint

  • 480

Profit from companies 14 160 1,200 Income and expenses in the parent company and central companies Management costs

  • 51
  • 66
  • 252

Financial items 12

  • 3
  • 56

Consolidated profit before tax

  • 25

91 892

1) Subsidiaries included with 100%. Investments recognised according to the equity method are included with holding percentage of

pre-tax profit/loss.

2) Hafa Bathroom Group is included until October 2015. 3) Inwido is included in consolidated profit as an associate with a holding of 31% until April 2015 and 10% respectively until October 2015 when

the entire holding was divested.

4) Nordic Cinema Group is included through June 2015. The entire holding was sold in July 2015. 5) Serena Properties is included in consolidated profit as a joint venture with a holding of 56% from 27 January 2016. 6) Speed Group is included from September 2015. 7) TFS is included from October 2015.

slide-15
SLIDE 15

15 January – March Interim report 2016

Financial position

Cash flow from operating activities and investing activities was SEK -384m (-161) and consolidated cash and cash equivalents at the end of the period amounted to SEK 6,068m (5,132). Interest-bearing liabilities including pension provisions amount- ed to SEK 8,776m (11,288).

Parent company

The parent company’s loss before tax amounted to SEK -37m (-65). The parent company’s cash and cash equivalents amounted to SEK 4,123m (3,122). Taking into account financial transactions agreed but not yet implemented (including divi- dends paid in April in the amount of SEK 1 billion), Ratos had a net liquidity of approximately SEK 2.6 billion at 10 May 2016. In addition, there is a credit facility of SEK 2.2 billion, authorisa- tion from the 2016 Annual General Meeting to issue a maxi- mum of 35 million Ratos B shares in conjunction with agree- ments on acquisitions and an authorisation to issue a maximum total of 1,250,000 Class C and/or Class D preference shares in conjunction with acquisitions.

Ratos Class B shares

Earnings per share before dilution amounted to SEK -0.18 (-0.14). The closing price for Ratos’s Class B shares on 31 March was SEK 52.05. Total return on Class B shares in the first quarter of 2016 amounted to +7%, compared with the perfor- mance for the SIX Return Index which was -3%.

Ratos preference shares

The closing price for Ratos’s Class C preference share on 31 March was SEK 1,883. The dividend is regulated by the Articles of Association and amounts to SEK 100 per year and is paid quarterly in February, May, August and November. Redemption can take place following a decision by the Board for an amount of SEK 2,012.50 (corresponding to 115% of the subscription price) until the 2017 Annual General Meeting, and subsequent redemption will take place for an amount of SEK 1,837.50 (corresponding to 105% of the subscription price). A dividend with the record date of 15 February 2016 was paid on 18 February 2016, totalling SEK 18m.

Treasury shares and number of shares

During the first quarter of 2016, 22,617 Class C preference shares were repurchased at an average price of SEK 1,886 per

  • share. As of 31 March 2016, a total of 112,471 Class C prefer-

ence shares have been repurchased. No Class B shares were repurchased and no call options were exercised. 1,344 Class B shares were transferred to administrative employees in accord- ance with an Annual General Meeting resolution. At the end of March, Ratos owned 5,126,262 Class B shares (corresponding to 1.6% of the total number of shares), repurchased at an aver- age price of SEK 68. At 31 March, the total number of shares in Ratos (Class A and B shares as well as preference shares) amounted to 324,970,896 and the number of votes was 108,670,443.6. The number of outstanding Class A and B shares was 319,014,634 and the number of outstanding preference shares 717,529. The average number of Class B treasury shares in Ratos in the first quarter of 2016 was 5,127,098 (5,128,279 in the full year 2015).

slide-16
SLIDE 16

16 January – March Interim report 2016

Ratos’s equity 1)

At 31 March 2016, Ratos’s equity (attributable to owners of the parent) amounted to SEK 12,869m (SEK 12,882m at

Credit facilities

The parent company has a credit facility of SEK 2.2 billion, including a bank overdraft facility. The purpose of the credit facility is to be able to use it when bridge financing is required for acquisitions and to be able to finance dividends and day- to-day running costs in periods of few or no exits. The parent company should normally be unleveraged. The credit facility was unutilised at the end of the period.

SEKm 31 March 2016 % of equity AH Industries 118 1 Aibel 1,559 12 ArcusGruppen 684 5 Biolin Scientific 351 3 Bisnode 1,248 10 DIAB 658 5 Euromaint 185 1 GS-Hydro 146 1 HENT 220 2 HL Display 802 6 Jøtul 89 1 KVD 317 2 Ledil 481 4 Mobile Climate Control 1,045 8 Nebula 246 2 Serena Properties 362 3 Speed Group 295 2 TFS 138 1 T

  • tal

8,947 70 Other net assets in the parent company and central companies 3,922 30 Equity (attributable to owners of the parent) 12,869 100 Equity per ordinary share, SEK 2) 36

1) Companies are shown at consolidated figures, which correspond to the Group’s share of the companies’ equity, any residual values on consolidated

surplus and deficit values, minuts intra-group profits. Shareholder loans are also included.

2) Equity attributable to owners of the parent with deductions for outstanding preference capital divided by the number of outstanding ordinary shares

at the end of the period. Preference capital per preference share amounted to SEK 1,837.50, which corresponds to the redemption amount after the 2017 Annual General Meeting.

31 December 2015), corresponding to SEK 36 per share

  • utstanding (SEK 36 at 31 December 2015).
slide-17
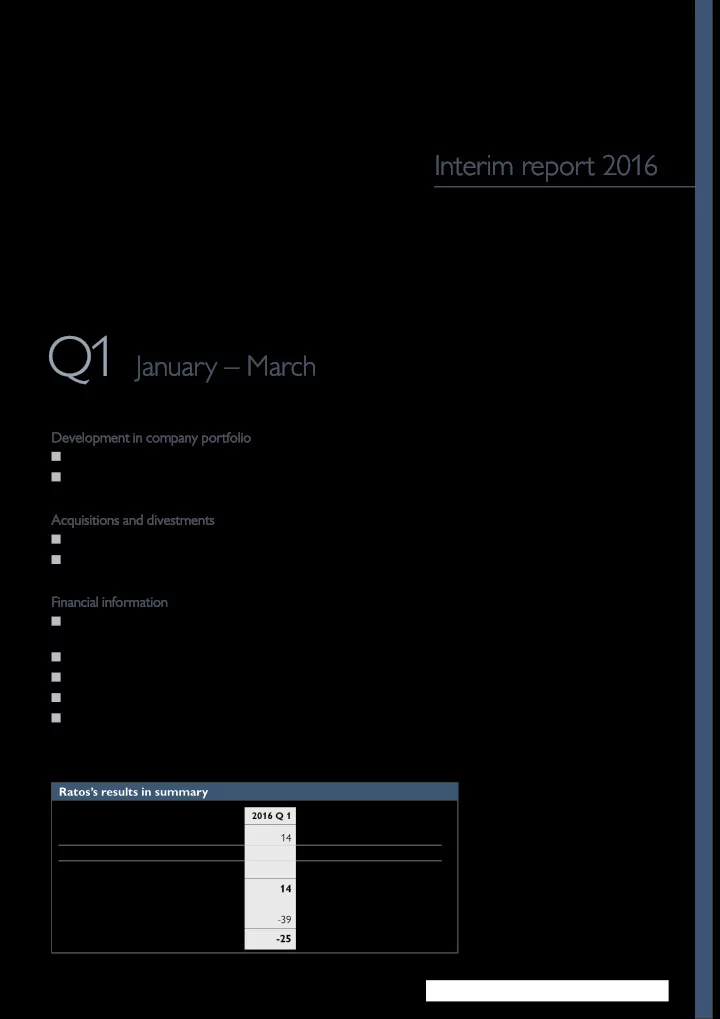
SLIDE 17

17 January – March Interim report 2016

Other information

Resolutions at the Annual General Meeting

Election of the Board of Directors and auditor

The Annual General Meeting (AGM) resolved in accordance with the Nomination Committee’s proposal and to re-elect Board members Annette Sadolin, Karsten Slotte, Charlotte Strömberg, Jan Söderberg and Per-Olof Söderberg. Ulla Litzén and Jonas Wiström were elected as new members of the

  • Board. Jonas Wiström was elected Chairman of the Board. A

more detailed presentation of the Board members is available at www.ratos.se. The AGM elected PricewaterhouseCoopers AB as auditor for the period until the next AGM.

Dividend on Class A and Class B shares

The AGM resolved on an ordinary dividend of SEK 3.25 (3.25) per Class A and Class B share. The record date for the right to receive dividends was scheduled as 18 April and dividends were paid from Euroclear Sweden on 21 April 2016.

Dividend Class C preference shares

The AGM resolved that a dividend on outstanding Class C preference shares until the 2017 AGM, in accordance with the Articles of Association, shall be paid quarterly in an amount

  • f SEK 25 per Class C preference share, subject to a maximum

amount of SEK 100. The following dates are proposed as record dates for the quarterly dividends: 13 May 2016, 15 August 2016, 15 November 2016 and 15 February 2017. Payments from Euroclear Sweden AB are expected to be made on 18 May 2016, 18 August 2016, 18 November 2016 and 20 February 2017.

Purchase of treasury shares

The AGM gave the Board a mandate to decide, during the period until the next AGM, on repurchase of a maximum num- ber of shares so that the company’s holding of treasury shares does not at any time exceed 7% of the total number of shares in the company.

Incentive programmes

The AGM resolved to issue a maximum of 800,000 call options

  • n Ratos Class B treasury shares to be transferred for a market

premium to key people within Ratos. The AGM further resolved to transfer a maximum of 800,000 treasury shares when the above-mentioned options are exercised. The AGM also resolved on a cash-settled option pro- gramme related to Ratos’s investments in the holdings. The programme will be carried out by issuing synthetic options which key people within Ratos will be entitled to acquire at market price. The AGM also resolved on a transfer of a maximum of 16,000 Ratos B treasury shares to administrative employees at Ratos.

Authorisation for new issue of Class B shares to be used at acquisitions

The AGM resolved to authorise the Board, during the period until the next AGM, in conjunction with agreements on com- pany acquisitions, on one or several occasions, with or without deviation from the pre-emptive rights of shareholders, for a cash payment, through set-off or non-cash, to make a decision

  • n a new issue of Ratos shares. This authorisation comprises a

maximum of 35 million Class B shares.

Authorisation for new issue of preference shares to be used at acquisitions

The AGM further resolved to authorise the Board, during the period until the next AGM, in conjunction with agreements on company acquisitions, on one or several occasions, with or with-

  • ut deviation from the pre-emptive rights of shareholders, for a

cash payment, through set-off or non-cash, to make a decision

  • n a new issue of Class C and/or Class D preference shares.

The authorisation shall comprise a maximum total of 1,250,000 Class C and/or Class D preference shares. The AGM further resolved on amendments to the Articles

  • f Association to enable a new issue of Class D preference

shares as well as dividends on Class C and/or Class D shares which may be issued prior to the 2017 AGM to be paid quar- terly of SEK 25 per Class C and/or Class D preference share, subject to a maximum of SEK 100.

slide-18
SLIDE 18

18 January – March Interim report 2016

Consolidated income statement

Financial statements

SEKm 2016 Q 1 2015 Q 1 2015 Net sales 5,905 6,203 24,480 Other operating income 13 29 120 Change in inventories of products in progress, finished goods and work in progress 23 11 Work performed by the company for its own use and capitalised 20 3 88 Raw materials and consumables

  • 3,118
  • 3,077
  • 12,395

Employee benefit costs

  • 1,718
  • 1,764
  • 6,824

Depreciation and impairment of property, plant and equipment and intangible assets

  • 129
  • 170
  • 1,345

Other costs

  • 865
  • 982
  • 3,890

Capital gain from sale of group companies

  • 13
  • 2

901 Capital gain from sale of investments recognised according to the equity method 290 Share of pre-tax profit/loss from investments recognised according to the equity method 1)

  • 37

13

  • 14

Operating profit 81 266 1,411 Financial income 23 12 88 Financial expenses

  • 129
  • 187
  • 606

Net financial items

  • 105
  • 175
  • 518

Profit/loss before tax

  • 25

91 892 Tax

  • 26
  • 62
  • 252

Share of tax from investments recognised according to the equity method 1) 10

  • 2

36 Profit/loss for the period

  • 40

27 676 Profit/loss for the period attributable to: Owners of the parent

  • 40
  • 25

496 Non-controlling interests 52 180 Earnings per share, SEK – before dilution

  • 0.18
  • 0.14

1.29 – after dilution

  • 0.18
  • 0.14

1.29

1) Tax attributable to shares of profit/loss before tax from investments recognised according to the equity method are presented on a separate line.

slide-19
SLIDE 19

19 January – March Interim report 2016

Consolidated statement of comprehensive income

SEKm 2016 Q 1 2015 Q 1 2015 Profit/loss for the period

  • 40

27 676 Other comprehensive income Items that will not be reclassified to profit or loss: Remeasurement of defined benefit pension obligations, net

  • 14

86 Tax attributable to items that will not be reclassified to profit or loss 3

  • 22
  • 11

64 Items that may be reclassified subsequently to profit or loss: Translation differences for the period 116

  • 33
  • 546

Change in hedging reserve for the period 5

  • 11

1 Tax attributable to items that may be reclassified subsequently to profit or loss

  • 1

2 120

  • 42
  • 545

Other comprehensive income for the period 120

  • 53
  • 482

T

  • tal comprehensive income for the period

80

  • 26

194 Total comprehensive income for the period attributable to: Owners of the parent 43

  • 58

152 Non-controlling interest 37 32 41

slide-20
SLIDE 20

20 January – March Interim report 2016

SEKm 31 March 2016 31 March 2015 31 Dec 2015 ASSETS Non-current assets Goodwill 12,751 15,299 12,671 Other intangible non-current assets 1,637 1,610 1,623 Property, plant and equipment 1,797 2,727 1,789 Financial assets 2,903 4,164 2,522 Deferred tax assets 531 575 490 T

  • tal non-current assets

19,620 24,376 19,094 Current assets Inventories 1,938 2,192 1,890 Current receivables 4,406 4,571 4,875 Cash and cash equivalents 6,068 5,132 6,455 Assets held for sale 8 308 T

  • tal current assets

12,419 11,895 13,529 T

  • tal assets

32,039 36,271 32,623 EQUITY AND LIABILITIES Equity including non-controlling interests 15,310 16,918 15,302 Non-current liabilities Interest-bearing liabilities 6,460 8,507 5,886 Non-interest bearing liabilities 423 343 451 Pension provisions 459 581 454 Other provisions 99 151 112 Deferred tax liabilities 420 435 392 T

  • tal non-current liabilities

7,862 10,017 7,294 Current liabilities Interest-bearing liabilities 1,856 2,200 2,346 Non-interest bearing liabilities 6,341 6,717 6,796 Provisions 671 419 595 Liabilities attributable to Assets held for sale 291 T

  • tal current liabilities

8,868 9,336 10,028 T

  • tal equity and liabilities

32,039 36,271 32,623

Summary consolidated statement of financial position

slide-21
SLIDE 21

21 January – March Interim report 2016

Summary statement of changes in consolidated equity

31 March 2016 31 March 2015 31 Dec 2015

Owners

  • f the

parent Non- controlling interest T

  • tal

equity Owners

  • f the

parent Non- controlling interest T

  • tal

equity Owners

  • f the

parent Non- controlling interest T

  • tal

equity SEKm

Opening equity 12,882 2,419 15,302 14,026 2,983 17,009 14,027 2,982 17,009 Adjusted 1)

  • 11
  • 8
  • 19

Adjusted equity 12,882 2,419 15,302 14,015 2,974 16,990 14,027 2,982 17,009 Total comprehensive income for the period 43 37 80

  • 58

32

  • 26

152 41 194 Dividends

  • 7
  • 7
  • 27
  • 27
  • 1,120
  • 210
  • 1,330

Non-controlling interests' share of capital contribu- tion 20 20 Purchase of treasury shares

  • 43
  • 43
  • 166
  • 166

Option premiums 3 3 Put options, future acquisitions from non- controlling interests

  • 2
  • 1
  • 3
  • 139
  • 139

Acquisition of shares in subsidiaries from non- controlling interests

  • 13
  • 8
  • 21
  • 16
  • 2
  • 18
  • 15
  • 2
  • 18

Disposal of shares in sub- sidiaries to non-controlling interests 2 3 5 Non-controlling interests at acquisition 274 274 Non-controlling interests in disposals

  • 551
  • 551

Closing equity 12,869 2,441 15,310 13,941 2,977 16,918 12,882 2,419 15,302

1) Adjusted opening equity attributed to Nordic Cinema Group.

slide-22
SLIDE 22

22 January – March Interim report 2016

SEKm 2016 Q 1 2015 Q 1 2015 Operating activities Profit/loss before tax

  • 25

91 892 Adjustment for non-cash items 259 53 203 234 144 1,096 Income tax paid

  • 81
  • 106
  • 288

Cash flow from operating activities before change in working capital 153 38 807 Cash flow from change in working capital: Increase (-)/Decrease (+) in inventories

  • 29
  • 48

83 Increase (-)/Decrease (+) in operating receivables 560 339

  • 293

Increase (+)/Decrease (-) in operating liabilities

  • 549
  • 243

655 Cash flow from operating activities 134 87 1,252 Investing activities Acquisition, group companies

  • 16
  • 73
  • 587

Disposal, group companies

  • 12

22 1,532 Acquisitions, investments recognised according to the equity method

  • 103

Disposals, investments recognised according to the equity method 1,599 Dividends paid from investments recognised according to the equity method 12 Purchase, intangible assets/property, plant and equipment

  • 128
  • 188
  • 697

Disposal, intangible assets/property, plant and equipment 2 3 44 Investments, financial assets

  • 261
  • 11
  • 1

Disposals, financial assets 42 Cash flow from investing activities

  • 518
  • 248

1,943 Financing activities Non-controlling interests' share of issue/capital contribution 20 Purchase of treasury shares

  • 43
  • 168

Redemption of options

  • 3
  • 41

Option premiums paid 7 1 18 Acquisition of shares in subsidiaries from non-controlling interests

  • 59
  • 71
  • 77

Dividends paid

  • 18
  • 21
  • 1,120

Dividends paid, non-controlling interests

  • 11
  • 19
  • 204

Borrowings 795 350 1,192 Amortisation of loans

  • 728
  • 291
  • 1,583

Cash flow from financing activities

  • 60
  • 52
  • 1,961

Cash flow for the period

  • 444
  • 213

1,234 Cash and cash equivalents at the beginning of the year 6,455 5,320 5,320 Exchange differences in cash and cash equivalents 41 9

  • 100

Increase (-)/Decrease (+) of cash and cash equivalents classified as Assets held for sale 15 17 2 Cash and cash equivalents at the end of the period 6,068 5,132 6,455

Consolidated statement of cash flows

slide-23
SLIDE 23

23 January – March Interim report 2016

2016 Q 1 2015 Q 1 2015 Return on equity, % 4 Equity ratio, % 48 47 47 Key figures per share 1) Total return, % 7 26 9 Dividend yield, % 6.7 Market price, SEK 52.05 59.10 48.83 Dividend, SEK 3.25 Equity attributable to owners of the parent, SEK 2) 36 39 36 Earnings per share before dilution, SEK 3)

  • 0.18
  • 0.14

1.29 Average number of ordinary shares outstanding: – before dilution 319,013,798 319,021,331 319,012,617 – after dilution 319,013,798 319,021,331 319,012,617 Total number of registered shares 324,970,896 324,970,896 324,970,896 Number of shares outstanding 319,732,163 319,843,290 319,753,436 – of which, Class A shares 84,637,060 84,637,060 84,637,060 – of which, Class B shares 234,377,574 234,376,230 234,376,230 – of which, Class C shares 717,529 830,000 740,146

Consolidated key figures

1) Relates to Class B shares unless specified otherwise. 2) Equity attributable to owners of the parent with deductions for outstanding preference capital dividied by the number of outstanding ordinary

shares at the end of the period. Preference capital per preference share amounted to SEK 1,837.50, which corresponds to the redemption amount after the 2017 Annual General Meeting.

3) Profit for the period attributable to owners of the parent minus dividend for the period on preference shares divided by the average number of

  • utstanding ordinary shares.
slide-24
SLIDE 24

24 January – March Interim report 2016

Parent company income statement Parent company statement of comprehensive income

SEKm 2016 Q 1 2015 Q 1 2015 Other operating income 1 3 Other external costs

  • 19
  • 31
  • 110

Personnel costs

  • 27
  • 29
  • 141

Depreciation of property, plant and equipment

  • 1
  • 1
  • 3

Operating profit

  • 45
  • 61
  • 252

Gain from sale of participating interests in group companies 8 Dividends from group companies 4 983 Impairment of shares in group companies

  • 1,033

Gain from sale of interests in associates 920 Dividends from associates 12 Result from other securities and receivables accounted for as non-current assets 6 Other interest income and similar profit/loss items 13 1 5 Interest expenses and similar profit/loss items

  • 4
  • 10
  • 61

Profit/loss after financial items

  • 37
  • 65

587 Tax Profit/loss for the period

  • 37
  • 65

587 SEKm 2016 Q 1 2015 Q 1 2015 Profit/loss for the period

  • 37
  • 65

587 Comprehensive income for the period

  • 37
  • 65

587

slide-25
SLIDE 25

25 January – March Interim report 2016

Summary parent company balance sheet

SEKm 31 March 2016 31 March 2015 31 Dec 2015 ASSETS Non-current assets Property, plant and equipment 66 69

67 Financial assets 9,445 9,608 8,961 T

  • tal non-current assets

9,511 9,678 9,028 Current assets Current receivables 22 7 87 Cash and cash equivalents 4,123 3,122 4,677 T

  • tal current assets

4,146 3,129 4,764 T

  • tal assets

13,657 12,807 13,792 EQUITY AND LIABILITIES Equity 10,632 11,342 10,711 Non-current provisions Other provisiosn 10 10 23 Non-current liablities Interest-bearing liabilities, group companies 895 525 879 Non-interest bearing liabilities 31 46 50 Current provisions 328 160 309 Current liabilities Interest-bearing liabilities, group companies 1,671 638 1,714 Non-interest bearing liabilities 90 86 105 T

  • tal equity and liabilities

13,657 12,807 13,792 Pledged assets none none none Contingent liabilities 368 631 400 SEKm 31 March 2016 31 March 2015 31 Dec 2015 Opening equity 10,711 11,406 11,406 Comprehensive income for the period

  • 37
  • 65

587 Dividends

  • 1,120

Purchase of treasury shares

  • 43
  • 166

Option premiums 3 Closing equity 10,632 11,342 10,711

Summary statement of changes in parent company’s equity

slide-26
SLIDE 26

26 January – March Interim report 2016

SEKm 2016 Q 1 2015 Q 1 2015 Operating activities Profit/loss before tax

  • 37
  • 65

587 Adjustment for non-cash items

  • 12

12

  • 354
  • 48
  • 53

233 Income tax paid – – – Cash flow from operating activities before change in working capital

  • 48
  • 53

233 Cash flow from change in working capital: Increase (-)/Decrease (+) in operating receivables

  • 6

7

  • 72

Increase (+)/Decrease (-) in operating liabilities

  • 19
  • 22
  • 63

Cash flow from operating activities

  • 73
  • 68

98 Investing activities Investment, shares in subsidiaries

  • 431
  • 92
  • 749

Disposal, shares in subsidiaries 51 107 Liabilities to group companies 1) 1,668 Disposal, shares in associates 1,595 Disposals, financial assets 22 Cash flow from investing activities

  • 431
  • 41

2,643 Financing activities Purchase of treasury shares

  • 43
  • 168

Option premiums paid 1 1 4 Redemption options

  • 31

Dividends paid

  • 18
  • 21
  • 1,120

Cash flow from financing activities

  • 60
  • 20
  • 1,314

Cash flow for the period

  • 564
  • 129

1,426 Cash and cash equivalents at the beginning of the year 4,677 3,251 3,251 Exchange differences in cash and cash equivalents 11 Cash and cash equivalents at the end of the year 4,123 3,122 4,677

Parent company cash flow statement

1) Liability to centrally administered group companies that arose in conjunction with divestments of group companies.

slide-27
SLIDE 27

27 January – March Interim report 2016

Accounting principles in accordance with IFRS

The consolidated financial statements are prepared in accordance with International Financial Reporting Standards (IFRS). The interim report is prepared in accordance with IAS 34, Interim Financial Reporting. Pertinent regulations in the Swedish Annual Accounts Act are also applied. The parent company’s interim report is prepared in accordance with the Annual Accounts Act, which is in accordance with the regulations in RFR 2 Accounting for Legal Entities. IFRS requires uniform accounting principles within a group. The IFRS standards and issued interpretations applied in this interim report are those endorsed by the EU until and including 31 December 2015. The new and revised IFRS standards which came into force in 2016 have not had any material effect on the Ratos Group’s financial statements. This means that the same accounting principles and basis of calculation are applied for the Group and the parent company as those used in preparation of the 2015 Annual Report. Ratos invests in and develops manily unlisted companies in the Nordic

  • region. These operations include inherent risks attributable to both Ratos

and the companies. These mainly comprise market, operational and transaction risks and can include both general risks, such as external factors and macroeconomic development, as well as company- and sector-specific

  • risks. Ratos’s future earnings development is dependent to a large extent
  • n the success and returns of the underlying companies which is also

dependent, among other things, on how successful the investment organi- sation and each company’s management group and board are at developing and implementing value-enhancing initiatives. Ratos is also exposed to various types of financial risks, primarily related to loans, trade receivables, trade payables and derivative instru-

  • ments. The financial risks consist of financing risks, interest rate risks, credit

risks and currency risks. It is also essential that Ratos has the ability to attract and retain employees with the right skills and experience. A more detailed description of the material risks and uncertainties to which the Group and the parent company are exposed is provided in the Directors’ report and in Notes 30 and 37 in the 2015 Annual Report. An assessment for the coming months is provided in the CEO comments on performance in the first quarter of 2016 on pages 3–4.

Risks and uncertainties Acquired and divested businesses

Acquisition of Serena Properties

In November 2015, Ratos signed an agreement to acquire 56% of the shares in Serena Properties, a newly formed real estate company with com- mercial retail properties in Finland. The purchase price (enterprise value) for 100% of the company amounted to EUR 191.5m, of which Ratos pro- vided EUR 39m (SEK 359m) when the acquisition was completed in January

  • 2016. The acquisition was carried out when Ratos, via wholly owned

subsidiary Aneres Properties AB, subscribed for shares in the newly formed

  • wner company Serena Properties AB, which in turn acquired a number of

Finnish real estate companies. The amount provided includes lending to the Serena Properties Group from Aneres Properties. Serena Properties is a joint venture in which Ratos has joint controlling influence and the company is therefore recognised according to the equity method in the Group. Serena Properties owns and manages 22 retail properties located across 14 mid-size towns in Finland. The properties are located in estab- lished retail areas with tenants that are attractive and largely comprise grocery and discount retailers. The properties were previously 100%

  • wned by Varma, which following the sale, will retain 43% ownership in

Serena Properties. Redito is commissioned as property portfolio manager and has acquired 1% of the shares.

Acquisition of subsidiary after the end of the reporting period

In February, Ratos signed an agreement to acquire 70% of the shares in

  • airteam. The purchase price (enterprise value) for 100% of the company

amounted to DKK 575m, of which Ratos provided DKK 272m. The final acquisition price is subject to working capital adjustment. The acquisition was completed in April 2016. airteam offers high-quality, effective ventilation solutions in Denmark and is headquartered in Aarhus. The company focuses on project develop- ment, project management and procurement where the projects, to a large extent, are carried out by a broad network of quality-assured subcontrac-

  • tors. Furthermore, airteam offers maintenance and service of its installed

solutions.

Acquisitions within subsidiaries

During the quarter, Bisnode acquired three new subsidiaries to strengthen its position in Central Europe.

Disposals within subsidiaries

Ratos’s subsidiary Euromaint signed an agreement in December 2015 to sell all its shares in its German subsidiary. The divestment was completed during the first quarter of 2016.

Note 1 Note 2 Note 3

slide-28
SLIDE 28

28 January – March Interim report 2016

Operating segments

1) Subsidiaries included with 100%. Investments recognised according to the equity method are included with holding percentage of

pre-tax profit/loss.

2) Hafa Bathroom Group is included until October 2015. 3) Inwido is included in consolidated profit as an associate with a holding of 31% until April 2015 and 10% respectively until October 2015

when the entire holding was divested.

4) Nordic Cinema Group is included through June 2015. The entire holding was sold in July 2015. 5) Serena Properties is included in consolidated profit as a joint venture with a holding of 56% from 27 January 2016. 6) Speed Group is included from September 2015. 7) TFS is included from October 2015.

Sales EBT 1) SEKm 2016 Q 1 2015 Q 1 2015 2016 Q 1 2015 Q 1 2015

AH Industries 223 271 1,013

  • 11
  • 6
  • 15

Aibel

  • 38
  • 8
  • 75

ArcusGruppen 521 549 2,586

  • 15
  • 26

106 Biolin Scientific 44 52 227

  • 11
  • 4

3 Bisnode 856 873 3,535

  • 71

201 DIAB 360 369 1,450 10 28 105 Euromaint 404 593 2,273 1

  • 224

GS-Hydro 236 320 1,175

  • 27

4 11 Hafa Bathroom Group 2) 52 149 2 3 HENT 1,832 1,284 5,716 64 48 194 HL Display 349 337 1,488 14

  • 22
  • 28

Inwido 3) 7 42 Jøtul 199 209 930

  • 6
  • 32
  • 42

KVD 78 76 317 4 6 21 Ledil 87 70 297 28 8 65 Mobile Climate Control 321 290 1,264 32 5 108 Nebula 83 66 299 20 14 71 Nordic Cinema Group 4) 791 1,356 136 108 Serena Properties 5) 3 Speed Group 6) 141 203 10 10 TFS 7) 170 203 6

  • 2

T

  • tal

5,905 6,203 24,480 14 160 664 Exit Nordic Cinema Group 905 Exit Inwido 290 Exit Hafa Bathroom Group

  • 93

T

  • tal exit result

1,101 Impairment AH Industries

  • 85

Impairment Euromaint

  • 480

Companies total 5,905 6,203 24,480 14 160 1,200 Income and expenses in the parent company and central companies

  • 39
  • 69
  • 308

Group total 5,905 6,203 24,480

  • 25

91 892

Note 4

slide-29
SLIDE 29

29 January – March Interim report 2016 Accumulated Accumulated SEKm cost impairment T

  • tal

Opening balance 1 January 2016 14,543

  • 1,872

12,671 Business combinations 9 9 Reclassifications 3 3 Translation differences for the year 89

  • 20

69 Closing balance 31 March 2016 14,644

  • 1,892

12,751 Ratos applies fair value measurements to a limited extent and mainly for derivatives and synthetic options, contingent considerations and put

  • ptions. These items are measured according to levels two and three

respectively in the fair value hierarchy. Valuation techniques are unchanged during the period. In the statement of financial position at 31 March 2016, the total value

  • f financial instruments measured at fair value in accordance with level

three amounts to SEK 467m (504 at 31 December 2015). The change in

Financial instruments

carrying amount since 31 December 2015, SEK -37m, mainly comprises payment for redeemed put options. In the statement of financial position at 31 March 2016, the net value

  • f derivatives amounts to SEK -47m (-52), of which SEK 5m (3) is recog-

nised as an asset and SEK 52m (55) as a liability.

Goodwill

Goodwill changed during the period as shown below.

Related party disclosures

Transactions with related parties are made on market terms.

Parent company

The parent company has a related party relationship with its group com- panies, for more information see Note 33 in the 2015 Annual Report. The parent company has no pledged assets. The parent company has contingent liabilities to subsidiaries and associates amounting to SEK 368m (400 at 31

Interest Interest Capital Contingent SEKm expenses income Dividend Provision Receivable Liability contribution liability

31 March 2016 Subsidiaries/associates 328 2,566 120 368 31 March 2015 Subsidiaries/associates

  • 4

4 160 1 1,168 37 631 31 Dec 2015 Subsidiaries/associates

  • 8

995 309 88 2,594 270 400 During the quarter, Ratos provided a total of SEK 120m to Euromaint in conjunction with a new financing agreement. December 2015). In addition, the parent company guarantees that Medcro Intressenter AB and Aneres Properties AB fulfil their obligations in conjunc- tion with the acquisition of TFS and the acquisition of Serena Properties respectively.

Note 5 Note 6 Note 7

slide-30
SLIDE 30

30 January – March Interim report 2016

T elephone conference 10 May 10.00 CET UK +44 20 3008 9808 US +1 855 831 5945 SE +46 8 566 425 09 Financial calendar 2016 19 Aug Interim report January – June 10 Nov Interim report January – September CEO’s comments Listen to CEO Susanna Campbell’s comments on the interim report at www.ratos.se

Ratos AB (publ) Drottninggatan 2 Box 1661 SE-111 96 Stockholm T el +46 8 700 17 00 www.ratos.se Reg. no. 556008-3585

Ratos owns and develops unlisted medium-sized companies in the Nordic region. The goal as an active owner is to contribute to long-term and sustainable operational development in our companies, and to implement value-creating transactions. Ratos’s portfolio comprises the companies AH Industries, Aibel, airteam, ArcusGruppen, Biolin Scientific, Bisnode, DIAB, Euromaint, GS-Hydro, HENT, HL Display, Jøtul, KVD, Ledil, Mobile Climate Control, Nebula, Serena Properties, Speed Group and TFS. Ratos is listed on Nasdaq Stockholm and has approximately 16,000 employees.

This information is disclosed pursuant to the Swedish Securities Market Act, the Swedish Financial Instruments Trading Act

  • r requirements stipulated in the listing agreement.

Stockholm, 10 May 2016 Ratos AB (publ) Susanna Campbell CEO For further information, please contact: Susanna Campbell, CEO, +46 8 700 17 00 Elin Ljung, Head of Corporate Communications, +46 8 700 17 20 This report has not been reviewed by Ratos’s auditors.