
SLIDE 1
Karsten M. Heeger Yale University
- n behalf of the PROSPECT collaboration
1
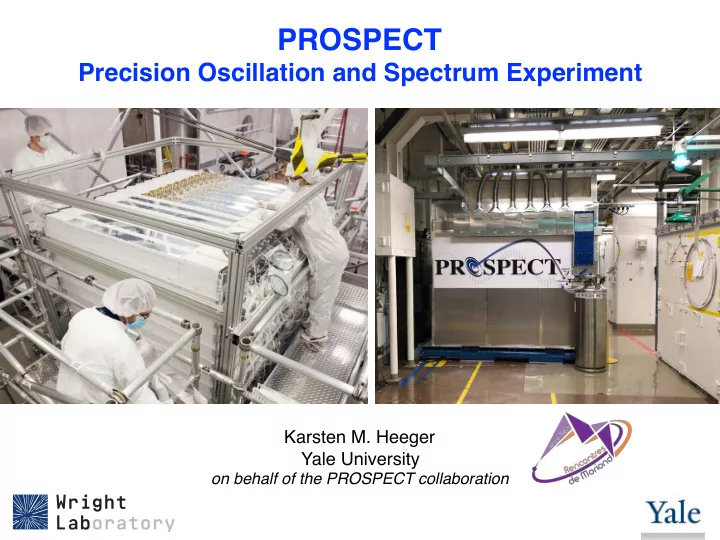
PROSPECT
Precision Oscillation and Spectrum Experiment
PROSPECT Precision Oscillation and Spectrum Experiment Karsten M. - - PowerPoint PPT Presentation
PROSPECT Precision Oscillation and Spectrum Experiment Karsten M. Heeger Yale University on behalf of the PROSPECT collaboration 1 Reactor Antineutrinos e from -decays, pure e source of n-rich fission products on average ~6 beta
Karsten M. Heeger Yale University
1
PROSPECT
Precision Oscillation and Spectrum Experiment
Karsten Heeger, Yale University Moriond 2019
mean energy of νe: 3.6 MeV
experiments possible
Reactor Antineutrinos
2
νe from β-decays, pure νe source
> 99.9% of νe are produced by fissions in
235U, 238U, 239Pu, 241Pu
Karsten Heeger, Yale University Moriond 2019
Reactor Antineutrino “Anomalies” (RAA)
3
Flux Deficit
Deficit due to extra (sterile) neutrino
Spectral Deviation
Measured spectrum does not agree with predictions.
Daya Bay, CPC 41, No. 1 (2017)
Understanding reactor flux and spectrum anomalies requires additional data
Karsten Heeger, Yale University Moriond 2019
Reactor Antineutrino “Anomalies” (RAA)
4
Flux Deficit
Deficit due to extra (sterile) neutrino
Spectral Deviation
Measured spectrum does not agree with predictions.
Daya Bay, CPC 41, No. 1 (2017)
Understanding reactor flux and spectrum anomalies requires additional data
Karsten Heeger, Yale University Moriond 2019
Shielding Active Inner Detector
Precision Oscillation and Spectrum Experiment
5
Antineutrino Detector HFIR Core
Objectives Search for short-baseline oscillation at <10m Precision measurement of 235U reactor νe spectrum
Relative Spectrum Measurement relative measurement of L/E and spectral shape distortions Segmented, 6Li-loaded Detector unoscillated spectrum
Karsten Heeger, Yale University Moriond 2019
Experimental Site
6
Power: 85 MW Core shape: cylindrical Size: h=0.5m r=0.2m Duty-cycle: 46%, 7 cycles/yr, 24 days Fuel: HEU (235U)
Reactor Core highly-enriched (HEU): >99% of νe flux from 235U fission High Flux Isotope Reactor, ORNL compact reactor core, detector near surface, little overburden
Karsten Heeger, Yale University Moriond 2019
PROSPECT Detector Design
7
ation access along full segment length has successfully detected antineutr ent close to a reactor
119cm Floor Concrete Monolith
BORATED POLYETHELYNE INNER DETECTOR ARRAY WATER BRICK NEUTRON SHIELD
tilted array for calibration access
Optimized shielding to reduce cosmogenic backgrounds
Single 4,000 L 6Li-loaded liquid scintillator (3,000 L fiducial volume) 11 x 14 (154) array of optically separated segments Very low mass separators (1.5 mm thick) Corner support rods allow for full in situ calibration access Double ended PMT readout, with light concentrators good light collection and energy response ~5%√E energy resolution full X,Y,Z event reconstruction
Karsten Heeger, Yale University Moriond 2019
Background Rejection
8
Pieter Mumm National Institute of Standards and Technology For the PROSPECT Collaboration
Combine:
A sequence of cuts leveraging spatial and timing characteristics of an IBD yields > 104 background suppression and signal to background of > 1:1.
IBD-like rate per segment n+H
12C inelasticRate and shape of residual IBD-like background can be measured during multiple interlaced reactor-off periods.
showers topology fiducialization PSD
rate [mHz/segment] 0.0 0.5 1.0 1.5 2.0
1.27 0.69 0.42 0.39 0.35 0.30 0.32 0.32 0.31 0.30 0.36 0.44 0.72 1.34 0.92 0.21 0.10 0.08 0.08 0.06 0.08 0.05 0.05 0.09 0.05 0.10 0.20 0.92 0.70 0.13 0.04 0.03 0.02 0.02 0.01 0.03 0.01 0.02 0.03 0.04 0.13 0.68 0.64 0.11 0.03 0.02 0.03 0.02 0.02 0.02 0.02 0.02 0.02 0.03 0.15 0.64 0.64 0.13 0.02 0.03 0.03 0.02 0.02 0.01 0.03 0.03 0.03 0.04 0.11 0.69 0.75 0.12 0.05 0.03 0.02 0.01 0.02 0.01 0.03 0.03 0.03 0.02 0.11 0.70 0.78 0.12 0.04 0.02 0.02 0.02 0.02 0.03 0.02 0.02 0.03 0.03 0.17 0.78 0.83 0.17 0.03 0.03 0.02 0.04 0.02 0.04 0.04 0.04 0.05 0.04 0.15 0.83 1.00 0.17 0.07 0.03 0.04 0.05 0.05 0.04 0.05 0.04 0.05 0.05 0.17 1.03 1.36 0.34 0.18 0.14 0.15 0.14 0.15 0.15 0.12 0.14 0.14 0.19 0.35 1.31 2.15 1.20 0.94 0.86 0.83 0.78 0.79 0.72 0.76 0.82 0.89 1.00 1.18 2.15segment x 5 10 segment z 2 4 6 8 10
Simulation Cosmogenic background Simulation
PROSPECT - arXiv:1808:00097
neutrinos
Detector design further optimized for background rejection
x
Assembly in 30s (video)
Assembly of First Row November 1, 2017
Final Row Installation November 17, 2017
Dry Commissioning Dec 2017 - Jan 2018
February 2018 Arrival at ORNL In Position at HFIR Filling from Mixing Tank First Muon Track
February 2018 Arrival at ORNL In Position at HFIR Filling from Mixing Tank Hadronic Shower
February 2018 Arrival at ORNL In Position at HFIR Filling from Mixing Tank IBD Candidate
Karsten Heeger, Yale University Moriond 2019
0.0 0.5 1.0 1.5 2.0 2.5 3.0 0.02 0.04 0.06 0.08 0.10 rec/E
Eσ (a)
Cs 137 Na 22 Na 22 nH Co 60 rec E E Resolution Model 0.0 0.5 1.0 1.5 2.0 2.5 3.0[MeV]
recE
20 40 60Rate [Hz] (b)
Na data 22 Best fit MC 0.0 0.5 1.0 1.5 2.0 2.5 3.0Energy [MeV] γ Average
0.96 0.98 1.00 1.02 1.04 MC/E
recE (c)
Cs 137 Na 22 Na 22 nH Co 60Energy Reconstruction
Gamma sources (137Cs, 60Co, 22Na) deployed throughout detector, measure single segment response Fast-neutron tagged 12B: High-energy beta spectrum calibration
15
4.5% at 1MeV
Resolution and Reconstruction
0.5 1 1.5 2 2.5 3 [MeV]
recE 0.02 0.04 0.06
(a) Gamma Sources Cs
137Co
60 Cs 137 Co 60 Best fit MC2 4 6 8 10 12 14 [MeV]
recE 0.2 0.4 0.6 0.8 Rate [mHz/MeV] B Spectrum
12(b)
MC/data for calibration peaks agrees to better than 1σ Full-detector Erec within ±1% of Etrue High light collection: 795±15 PE/MeV
E[MeV] Phys.Rev.Lett. 121 (2018) no.25, 251802 PROSPECT Collaboration
Karsten Heeger, Yale University Moriond 2019
03/05 03/22 04/08 04/25 05/12 05/30 Date (MM/DD) 500 1000 1500 Events per day
Correlated Accidentals
First Oscillation Analysis Data Set
33 days of Reactor On 28 days of Reactor Off Correlated S/B = 1.36 Accidental S/B = 2.25 24,608 IBDs detected Average of ~750 IBDs/day IBD event selection defined and frozen on 3 days of data
16
reactor on reactor off reactor on
maintenance calibration
Preliminary
Phys.Rev.Lett. 121 (2018) no.25, 251802 PROSPECT Collaboration
Karsten Heeger, Yale University Moriond 2019
Neutrino Rate vs Baseline
Observation of 1/r2 behavior throughout detector volume Bin events from 108 fiducial segments into 14 baseline bins 40% flux decrease from front of detector to back
17
PRELIMINARY Baseline (m) 7 7.5 8 8.5 9 Normalized IBD counts 0.6 0.8 1
Data
2
1/r
Data
2
1/r Data A/r2 fit
Phys.Rev.Lett. 121 (2018) no.25, 251802 PROSPECT Collaboration
Karsten Heeger, Yale University Moriond 2019
Neutrino Spectrum vs Baseline
18
Spectrum at baseline Full detector spectrum
1 2 3 4 5 6 7 Prompt Energy (MeV) 0.01 0.02 0.03 0.04 0.05 0.06 Rate Null oscillation Baseline 1 Baseline 2 Baseline 3 Baseline 4 Baseline 5 Baseline 6 Null oscillation Baseline 1 Baseline 2 Baseline 3 Baseline 4 Baseline 5 Baseline 6 Null oscillation Baseline 1 Baseline 2 Baseline 3 Baseline 4 Baseline 5 Baseline 6 Null oscillation Baseline 1 Baseline 2 Baseline 3 Baseline 4 Baseline 5 Baseline 6Prompt Energy Rate
Null Oscillation 6.7-7.1m 7.1-7.5m 7.5-8.0m 8.0-8.4m 8.4-8.8m 8.8-9.2m
Spectral Distortion vs Baseline Compare spectra from 6 baselines to measured full-detector spectrum Null-oscillation would yield a flat ratio for all baselines Direct ratio search for oscillations, reactor model independent
7 1 2 3 4 5 6 7 Prompt Spectrum(MeV)1 0.2 0.4 0.6 0.8 1 1.2 1.4 1.6 1.8 2
1 2 3 4 5 6 7 Prompt Spectrum(MeV)1.8 Ratio
1 2 3 4 5 6 7 Prompt Spectrum(MeV) 1 2 3 4 5 6 7 Prompt Energy (MeV) 1 2 3 4 5 6 7 Prompt Energy (MeV) 1 2 3 4 5 6 7 Prompt Energy (MeV)1.8 Ratio
1 0.2 0.4 0.6 0.8 1 1.2 1.4 1.6 1.8 2
3 4 5 (MeV)
rec
Prompt E
1 2 3 4 5 6 7 0.2 0.4 0.6 0.8 1 1.2 1.4 1.6 1.8 26.7-7.1 m Data RAA
1 2 3 4 5 6 7 0.2 0.4 0.6 0.8 1 1.2 1.4 1.6 1.8 28.0-8.4 m
1 2 3 4 5 6 7 0.2 0.4 0.6 0.8 1 1.2 1.4 1.6 1.8 2 7.1-7.5 m 1 2 3 4 5 6 7 0.2 0.4 0.6 0.8 1 1.2 1.4 1.6 1.8 2 8.4-8.8 m 1 2 3 4 5 6 7 0.2 0.4 0.6 0.8 1 1.2 1.4 1.6 1.8 2 7.5-8.0 m 1 2 3 4 5 6 7 0.2 0.4 0.6 0.8 1 1.2 1.4 1.6 1.8 2 8.8-9.2 mPhys.Rev.Lett. 121 (2018) no.25, 251802 PROSPECT Collaboration
Karsten Heeger, Yale University Moriond 2019
Oscillation Search Results
Disfavors RAA best-fit point at >95% CL (2.2𝝉)
19
confidence intervals for
all uncertainties and energy/ baseline correlations
from toy MC using full covariance matrix
Antineutrino Anomaly RAA best fit
Phys.Rev.Lett. 121 (2018) no.25, 251802 PROSPECT Collaboration
Karsten Heeger, Yale University Moriond 2019
New Measurement of 235U Spectrum
20
Prompt Energy Spectrum measured spectrum with good S/B at surface 1.7/1 (0.8-7.2 MeV) ~ 6x greater statistics than ILL (1981) 40.2 days of reactor-on exposure, 37.8days of reactor-off exposure
~ 31,000 IBD candidate events (reactor-off candidate events scaled to match exposure)
Preliminary
Karsten Heeger, Yale University Moriond 2019
Prompt Energy Spectrum
21
Preliminary
Is PROSPECT consistent with Huber
235U model for HFIR HEU reactor?
χ2/ndf = 52.1/31 p-value = 0.01 Huber model broadly agrees with spectrum but exhibits large χ2/ndf with respect to measured spectrum, not a good fit. Deviations mostly in two energy regions. Statistics limited measurement.
Karsten Heeger, Yale University Moriond 2019
Prompt Energy Spectrum
22
Prompt Positron Energy (MeV) 2 4 6 8 Entries / 250 keV 5000 10000 15000 20000 Data Full uncertainty Reactor uncertainty ILL+Vogel Integrated Prompt Energy (MeV) 2 4 6 8 Ratio to Prediction 0.8 0.9 1 1.1 1.2 (Huber + Mueller) 4 1 Prompt Energy (MeV) 2 4 6 8 4 − 10Shape of measured 235U spectrum not inconsistent with the deviation relative to prediction observed at LEU reactors.
Daya Bay
Preliminary
How does PROSPECT compare to “bump” in θ13 experiments?
best-fit excess
Karsten Heeger, Yale University Moriond 2019
Summary
23
PROSPECT started taking data on March 6, 2018 Background rejection and energy resolution meet expectation and match Monte Carlo. World-leading signal-to-background for a surface-based detector (<1 mwe overburden). Observed antineutrinos from HFIR with good signal/background. First oscillation analysis on 33 days of reactor-on data disfavors the RAA best-fit at 2.2𝝉. With a surface-based detector, highest-statistics measurement of
235U antineutrino spectrum from HEU reactor to date.
Based on results of PROSPECT and other experiments sterile neutrinos are increasingly disfavored
prospect.yale.edu
Funding provided by: 14 Institutions, 70 collaborators