
SLIDE 1
Proposed FY 2014 – 2023 Capital Improvement Program
1
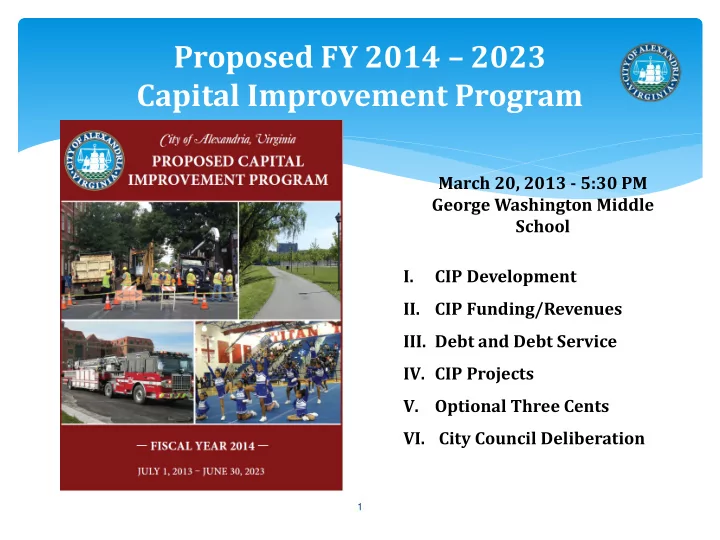
March 20, 2013 - 5:30 PM George Washington Middle School I. CIP Development II. CIP Funding/Revenues
- III. Debt and Debt Service
- IV. CIP Projects
V. Optional Three Cents
- VI. City Council Deliberation