project buds leaves and global warming
play

Project: Buds, Leaves, and Global Warming Monitoring the Growing - PowerPoint PPT Presentation

Harvard Forest Schoolyard LTER Research Project: Buds, Leaves, and Global Warming Monitoring the Growing Season of Deciduous Trees Deciduous trees! Leaf out/ Bud burst beginning of season Senescence (color change) and Leaf drop


  1. Harvard Forest Schoolyard LTER Research Project: Buds, Leaves, and Global Warming Monitoring the Growing Season of Deciduous Trees • Deciduous trees! • 
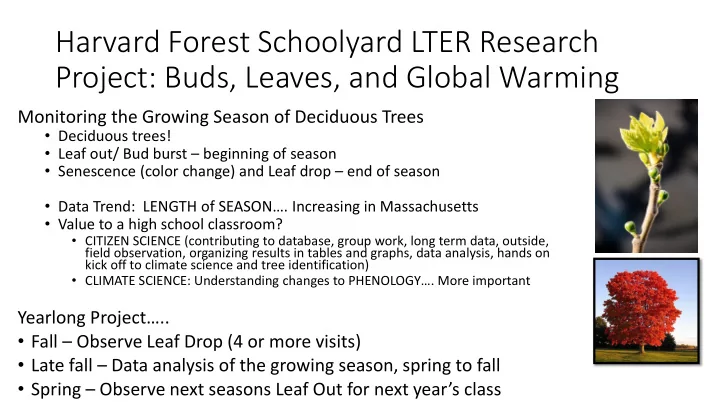
Leaf out/ Bud burst – beginning of season • Senescence (color change) and Leaf drop – end of season • Data Trend: LENGTH of SEASON…. Increasing in Massachusetts • Value to a high school classroom? • CITIZEN SCIENCE (contributing to database, group work, long term data, outside, field observation, organizing results in tables and graphs, data analysis, hands on kick off to climate science and tree identification) • CLIMATE SCIENCE: Understanding changes to PHENOLOGY…. More important Yearlong Project….. • Fall – Observe Leaf Drop (4 or more visits) • Late fall – Data analysis of the growing season, spring to fall • Spring – Observe next seasons Leaf Out for next year’s class

  2. Integrating into Curriculum: CP Envi. Sci. for Juniors Unit 3: Harvard Forest Buds/Leaves/Global Warming and Climate Change • FALL: September – Thanksgiving (at the same time as my soil/planting unit) • Harvard Forest Phenology Presentation • Focus on science between color change and leaf drop and tying it to climate • No explanation of how climate change works yet • Begin fall observations • Tree Identification – practice and start doing weekly Herbarium Entries • Students are creating scientific scrapbooks and using dichotomous keys • Climate Change: Greenhouse effect, effects in Massachusetts, effects worldwide • Finish fall observations • Screening of “Chasing Ice” documentary • WINTER: Late December – January • 1-3 Data manipulation days • skills: (data manipulation and analysis, excel, tables, graphing, maintaining skills last exercised before thanksgiving) • content: (connecting Harvard Forest content fall to spring, climate change connection as we discuss biomes and expected changes) • SPRING: April – June • Spring observations 6 or more • skills: (long term research, groupwork, field observation) • content: (gets us doing field work in 2 ways, we also do another spring field study, keeps climate in mind as we study energy)

  3. Tree Identification: Try being my students! • Each student brings a branch to school as a homework assignment • I walk through the following power point • At each slide, they consider what is true for their branch • After, we use “Tree Finder” dichotomous keys and try to ID their tree. • Ready to try it? Take out your branch and get ready to take notes!

  4. ALTERNATE or OPPOSITE Alternate Everything else! Opposite (MAD) Very few native trees Maple, ash, dogwood http://www.butler.edu/herbarium/treeid/treeparts.html

  5. SIMPLE vs. COMPOUND WHERE IS THE BUD? Leaf stalk: NOT AS WOODY AS BRANCHES http://www.butler.edu/herbarium/treeid/treeparts.html

  6. MARGINS: Like on paper, they are the EDGES 2 common lobe patterns: http://www.butler.edu/herbarium/treeid/treeparts.html

  7. Leaf Veins and Bristles Bristle (L) No bristle (R) One main vein (L) Many main veins (R) http://essmextension.tamu.edu/treecarekit/index.php/before-the- storm/tree-identification-and-selection/techniquies-to-identify-trees/

  8. Example ID using this information • The leaves are opposite, which means it must be a maple, ash, or dogwood • The leaves are NOT compound, so it must be a maple or a dogwood • The leaves have 3 big lobes, dogwoods don’t have lobed leaves but maple leaves have 3 lobes • The notches in the lobes are V shaped, not U shaped, so it cannot be a sugar maple or a Norway maple • It is a Red Maple! Acer rubrum ! • I used Mrs. Matthei’s slides and some maple tree searches on leaf snap for my identification

  9. Try to do your own ID! • Instead of the “Tree Finder” you can start with the information you just gathered and use websites if you are on the internet. • Great site my student found (based in Ohio but the ecology is usually similar enough): http://www.oplin.org/tree/leaf/byleaf.html

  10. Student Herbarium Entry Examples

  11. Student Herbarium Entry Examples

  12. Student Fall Season and DATA….. NDA Hingham Fall Observations: Mid September – Mid November • 9/24 – 11/13 last year ; 9/28 - ? this year • Once a week • ~6 observations total • groups of 2/3 to a tree • Each 15-20 minutes after the first 40 minute observation Assessments (Grade each observation): • Sketch both branches; sketch changes after • Fill out individual branch pages each time • Add to Louise Levy’s summary page, taped to a folder containing sketches and individual branch pages

  13. Student Spring Season….. NDA Hingham Spring Observations: Late March – Late May • 3/29 – 5/31 this year • Once a week • 6 observations total • Same students working in the same groups of 2/3 • Each 15-20 minutes after the first 40 minute observation Assessments (Grade each observation): • Sketch both branches; sketch changes after • Add to Louise Levy’s summary page, taped to a folder containing sketches and individual branch pages Overall Growing Season – Spring to Fall • Data manipulation occurs in the late fall, using their data and Spring data from the last class

  14. Student Fall Season and DATA….. NDA Hingham Data Manipulation • I submitted data to Harvard Forest • I created a blank data table spreadsheet file (using data from the Harvard Forest website) • Students saved the blank file as their own and added to it • Graded as a lab grade; took 80 minute class and then two 40 minute follow ups; completed for homework. Harvard Forest Schoolyard Database….. • Submit data • Download any data in excel format • Graph data online Database: http://harvardforest2.fas.harvard.edu/asp/hf /php/k12/k12_project.php

  15. Data file: want to be my student again? http://harvardforest.fas.harvard.edu/schoolyard/lesson-plans • Go to this page, find Matthei.2016. MAST Student Data Worksheet

  16. My Student Data File: Overview • (1 and 2) TABLE Creating a Table with This Year’s Data • Copy from other tab • Review for accuracy • (3) GRAPH : tree color and percentage of leaves fallen • Use data from table 1 • Calculate date when 50% have fallen. • (4) Consider 50% leaf drop data accuracy…. • (5) CONSIDER PATTERNS (HISTORY, FOR A SPECIES) Consider your trees historical data and compare it to others of its species • (6) Explore data… Ask your own question that you will answer with a graph, create the tables needed to make the graph, analyze your graph.

  17. Beginning of Student Data Page • Fun group name • Tree Species Code and # Blue Cells – Orange Cells –

  18. 1 and 2 This Year’s Data • Copy from other tab • Review for accuracy

  19. 3. 2 graphs: tree color and percentage of leaves fallen • Use data from table 1

  20. 3. 2 graphs: tree color and percentage of leaves fallen • Calculate date when 50% have fallen.

  21. 5. Consider your trees historical data and compare it to others of its species

Download Presentation
Download Policy: The content available on the website is offered to you 'AS IS' for your personal information and use only. It cannot be commercialized, licensed, or distributed on other websites without prior consent from the author. To download a presentation, simply click this link. If you encounter any difficulties during the download process, it's possible that the publisher has removed the file from their server.

Recommend


More recommend