SLIDE 1
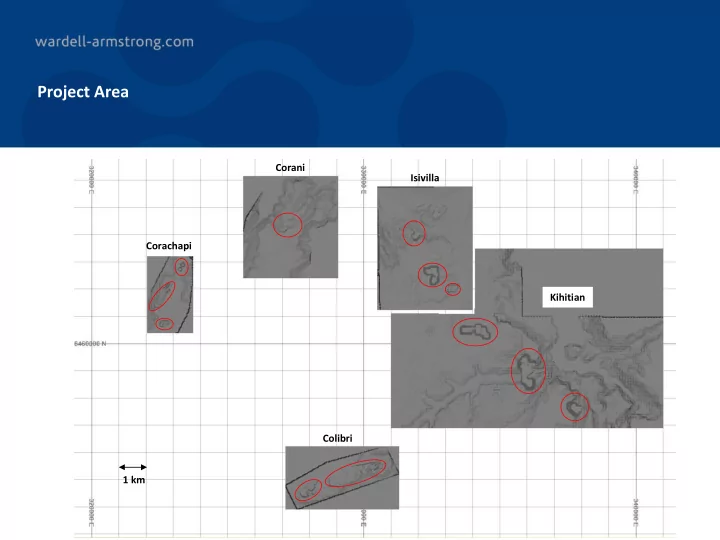
Project Area
N N Corachapi Colibri Kihitian Isivilla Corani 1 km
SLIDE 2
Colibri – Complex 2 (PLAN VIEW Looking Down)
Optimised Pit Shell shown.
SLIDE 3
Kihitian – Complex 3 (PLAN VIEW Looking Down)
Chilanco Chico Quebrada Blanca Tantamaco Tuturumani
Optimised Pit Shell shown.
SLIDE 4 Kihitian – Complex 3 (PLAN VIEW Looking Up)
Proportion of blocks above 200ppm are excluded from the open pits, portions of blocks outside Chilanco Chico, Quebrada Blanca, and
- Tantamaco. Tuturumani is also mostly excluded.
Chilanco Chico Quebrada Blanca Tantamaco Tuturumani
SLIDE 5
Kihitian – Complex 3 (PLAN VIEW Looking Up) + Underground
Underground design overlaid on Chilanco Chico above.
Chilanco Chico Underground
SLIDE 6
Isivilla – Complex 4 (PLAN VIEW Looking Down)
Isivilla Puncopata Calvario1
Optimised Pit Shell shown.
SLIDE 7 Isivilla – Complex 4 (PLAN VIEW Looking Up)
Most blocks above 200ppm are included within the
Some blocks on the edges of the open pit are excluded.
Isivilla Puncopata Calvario1
SLIDE 8 Complex 1 / Corachapi – Pit Shell Optimisation
Isometric View – Top Down Pit Optimisation shows formation of five main pit areas following the trend of mineralisation. Isometric View – Looking Underneath The blocks above the cut-off grade with grey indicate the cells are within the pit shell. Based on the filtered blocks, nearly all blocks are within the
- ptimised shell indicating an excellent conversion.
N.B. Blocks shown in images are shown a 100 U3O8 ppm cut-off.
N N
SLIDE 9 Complex 2 / Colibri – Pit Shell Optimisation
Isometric View – Top Down Pit Optimisation shows formation of three main pit areas following the trend
(Tupuramani Area to West / Colibri Area to East). Isometric View – Looking Underneath The blocks above the cut-off grade with grey indicate the cells are within the pit shell. Based on the filtered blocks, nearly all blocks are within the
- ptimised shell indicating an excellent conversion.
N.B. Blocks shown in images are shown a 100 U3O8 ppm cut-off. N N
SLIDE 10
Complex 3 / Kihitian – Pit Shell Optimisation
Isometric View – Top Down Pit Optimisation shows formation of a number of pit development areas. Project areas are labelled above. The ore formation in this project area is located some distance below surface, up to 200m below surface, generating large amounts of waste. This limits optimised pit shell development to sloping areas. Isometric View – Looking Underneath The blocks above the cut-off grade with grey indicate the cells are within the pit shell. As can be seen large portions associated with Chilcuno Chico are not extracted by Open Pit. Tantamaco also has portions of ore outside the pit, however it is low grade which may limit areas which can be economically extracted by Underground methods.
N.B. Blocks shown in images are shown a 100 U3O8 ppm cut-off. Tantamaco Tantamaco Tuturumani
Tuturumani Quebrada Blanca Quebrada Blanca Chilanco Chico Chilanco Chico N N
SLIDE 11 Complex 4 / Isivilla – Pit Shell Optimisation
Isometric View – Top Down Pit Optimisation shows formation of optimised pit shell around Resource areas, except Calvario Real. Isometric View – Looking Underneath The blocks above the cut-off grade with grey indicate the cells are within the pit shell. As can be seen the majority of blocks are recovered within the
- ptimised pit shell. Calvario Real and areas on the fringes of other Resource
areas are excluded due to low grade which would exclude the blocks from underground extraction.
N.B. Blocks shown in images are shown a 100 U3O8 ppm cut-off. Isivilla Calvario1 Calvario Real Puncopata Calvario1 Isivilla Puncopata
N N
SLIDE 12
Complex 5 / Corani – Pit Shell Optimisation
Isometric View – Top Down Pit Optimisation shows formation of many isolated small optimised pits around Resource area. Isometric View – Looking Underneath
N.B. Blocks shown in images are shown a 100 U3O8 ppm cut-off. Isivilla Calvario1 Puncopata N N The blocks above the cut-off grade with grey indicate the cells are within the pit shell. As can be seen a proportion of blocks are not included within optimised pits, however are low grade making underground extraction borderline. N