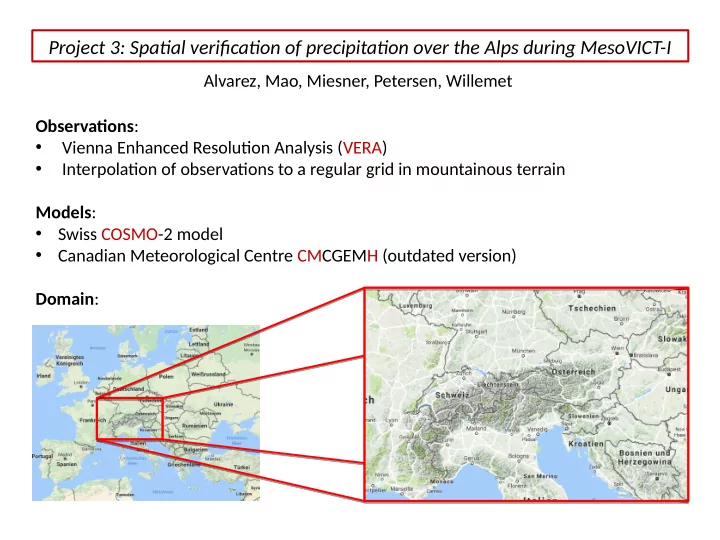
Project 3: Spatjal verifjcatjon of precipitatjon over the Alps during - - PowerPoint PPT Presentation

project 3 spatjal verifjcatjon of precipitatjon over the
SMART_READER_LITE
LIVE PREVIEW

Project 3: Spatjal verifjcatjon of precipitatjon over the Alps during - - PowerPoint PPT Presentation

Project 3: Spatjal verifjcatjon of precipitatjon over the Alps during MesoVICT-I Alvarez, Mao, Miesner, Petersen, Willemet Observatjons : Vienna Enhanced Resolutjon Analysis (VERA) Interpolatjon of observatjons to a regular grid in


slide-1
SLIDE 1

Observatjons:

  • Vienna Enhanced Resolutjon Analysis (VERA)
  • Interpolatjon of observatjons to a regular grid in mountainous terrain

Models:

  • Swiss COSMO-2 model
  • Canadian Meteorological Centre CMCGEMH (outdated version)

Domain:

Project 3: Spatjal verifjcatjon of precipitatjon over the Alps during MesoVICT-I

Alvarez, Mao, Miesner, Petersen, Willemet

slide-2
SLIDE 2

Methods (I): Fractjon Skill Score

Answers the questjon  “What are the spatjal scales at which the forecast resembles the observatjons?

  • How forecast skill varies with neighbourhood size
  • The smallest neighbourhood size that can be used to give suffjciently accurate

forecasts

  • Do higher resolutjon NWP provide more accurate forecasts on scales of interest

Target skill CAWR.gov.au/projects/verifjcatjon

1 0.5 chosen

slide-3
SLIDE 3

Methods (II): Contjguous Rain Areas (CRA)

Answers the questjon “What is the locatjon error of the (spatjal) forecast, and how does the total error break down into components due to incorrect locatjon, volume, and fjne scale structure?” Observed Forecast Users choose

  • threshold to defjne objects [1mm/h], and
  • patuern-matching functjon [R-verifjcatjon package default]

CAWR.gov.au/projects/verifjcatjon

slide-4
SLIDE 4

Evening 8th

Summer convectjve situatjon in the northern Alpine in August 2007

mesoVICT whitepaper

Night 6/7th Evening 7th

slide-5
SLIDE 5

OBSERVATIONS

19 UTC 07/08/2017 Lead: 13 hours

1 2 5 10

(mm/h) Neighborhood size (grid squares)

1 25

Field resolutjon: 8 km

Neighborhood size F S S

Fractjons Skill Score (FSS)

1 2 5 10

(mm/h)

No skill !

Neighborhood size (grid squares) Neighborhood size F S S

Fractjons Skill Score (FSS)

slide-6
SLIDE 6

OBSERVATIONS

No matches in CRA Dominant components of the errors are displacement and patuern errors 19 UTC 07/08/2017 Lead: 13 hours Error Displacement 61 % -8 % Volume 0% 1 % Patuern 40% 107 %

slide-7
SLIDE 7

OBSERVATIONS

10 UTC 08/08/2017 Lead: 4 hours

1 2 5 10

(mm/h) Neighborhood size (grid squares)

1 25

Neighborhood size F S S

Fractjons Skill Score (FSS)

1 2 5 10

(mm/h) Neighborhood size (grid squares) Neighborhood size F S S

Fractjons Skill Score (FSS)

slide-8
SLIDE 8

OBSERVATIONS

Dominant components of the errors are displacement and patuern errors 10 UTC 08/08/2017 Lead: 4 hours a a b b c c

slide-9
SLIDE 9

OBSERVATIONS

14 UTC 08/08/2017 Lead: 8 hours

1 2 5 10

(mm/h) Neighborhood size (grid squares)

1 25

Neighborhood size F S S

Fractjons Skill Score (FSS)

1 2 5 10

(mm/h) Neighborhood size (grid squares) Neighborhood size F S S

Fractjons Skill Score (FSS)

slide-10
SLIDE 10

14 UTC 08/08/2017 Lead: 8 hours

OBSERVATIONS

Dominant components of the errors are displacement and patuern errors a a b b

slide-11
SLIDE 11

Conclusions

  • Applying several forecast verifjcatjon metric is recommended !

FSS

  • Showed how skill varies with neighborhood size
  • Varying skill for difgerent rainfall thresholds and over tjme

CRA

  • Strength: error decomposed into
  • Displacement
  • Volume
  • Patuern
  • Weakness: patuern matching functjon and threshold must be carefully chosen
  • default might not suffjce