
SLIDE 1
1
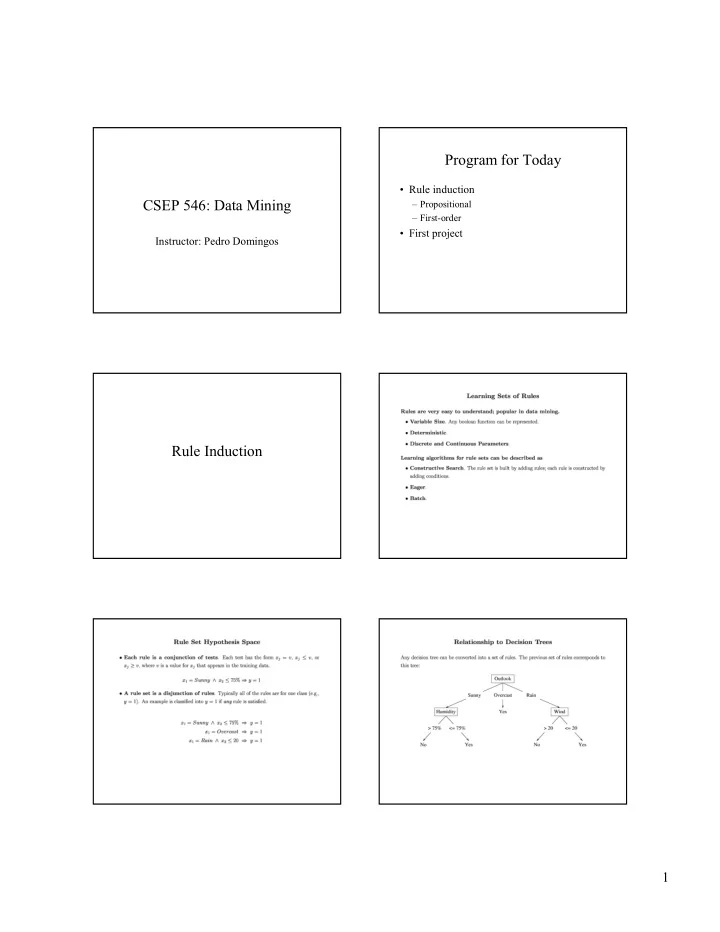
CSEP 546: Data Mining
Instructor: Pedro Domingos
Program for Today
- Rule induction
– Propositional – First-order
- First project
Program for Today Rule induction CSEP 546: Data Mining - - PDF document
Program for Today Rule induction CSEP 546: Data Mining Propositional First-order First project Instructor: Pedro Domingos Rule Induction 1 2 3 4 5 First Project: Clickstream Mining Overview The Gazelle Site
(assortment is a collection of products, such as back to school)
Algorithms Tried vs Submitted
2 4 6 8 10 12 14 16 18 20
Decision Trees Nearest Neighbor Association Rules Decision Rules Boosting Naïve Bayes Sequence Analysis Neural Network SVM Logistic Regression Linear Regression Genetic Programming Clustering Bagging Bayesion Belief Net Decision Table Markov Models
Algorithm
Entries
Tried Submitted
Cumulative Gains Chart for Sessions >= 5 Clicks 0.00% 10.00% 20.00% 30.00% 40.00% 50.00% 60.00% 70.00% 80.00% 90.00% 100.00% 0% 10% 20% 30% 40% 50% 60% 70% 80% 90% 100% X % continue 1st 2nd Random Optimal The 10% highest scored sessions account for 43%
Abandonment ratio 0.00% 10.00% 20.00% 30.00% 40.00% 50.00% 60.00% 70.00% 80.00% 90.00% 100.00% 1 3 5 7 9 11 13 15 17 19 21 23 25 27 29 31 33 35 37 39 41 43 45 47 49 Session length Percent abandonment Unclipped Training Set
average order tax > $2 implies heavy spender
Total Sales, Discounts, and "Heavy Spenders"
500 1000 1500 2000 2500 3000 3500 4000 4500 5000 1/27/00 2/3/00 2/10/00 2/17/00 2/24/00 3/2/00 3/9/00 3/16/00 3/23/00 3/30/00 Order date
$
0.00% 10.00% 20.00% 30.00% 40.00% 50.00% 60.00% 70.00% 80.00% 90.00% 100.00%
Percent heavy Discount Order amount
No data Discounts greater than order amount (after discount)
McBeal ad & $10 off promotion
Target segment
Note spike in traffic
Top Referrers
0% 20% 40% 60% 80% 100% 2/2/00 2/4/00 2/6/00 2/8/00 2/10/00 2/12/00 2/14/00 2/16/00 2/18/00 2/20/00 2/22/00 2/24/00 2/26/00 2/28/00 3/1/00 3/3/00 3/5/00 3/7/00 3/9/00 3/11/00 3/13/00 3/15/00 3/17/00 3/19/00 3/21/00 3/23/00 3/25/00 3/27/00 3/29/00 3/31/00 Session date Percent of top referrers 1000 2000 3000 4000 5000 6000 Fashion Mall Yahoo ShopNow MyCoupons Winnie-cooper Total from top referrers
Yahoo searches for THONGS
and Companies/Apparel/Lingerie
FashionMall.com
ShopNow.com Winnie- Cooper
MyCoupons.com
Winnie Cooper is a 31-year-old guy who wears pantyhose and has a pantyhose site. 8,700 visitors came from his site (!). Actions:
how hard it is for men to buy in stores
Send-email versus heavy-spender
0.00% 10.00% 20.00% 30.00% 40.00% 50.00% 60.00% 70.00% 80.00% 90.00% 100.00% 1 / 3 1 / 2 / 7 / 2 / 1 4 / 2 / 2 1 / 2 / 2 8 / 3 / 6 / 3 / 1 3 / 3 / 2 / 3 / 2 7 / Percent heavy Percent e-mail