
SLIDE 1
Program Analysis
Jose Lugo-Martinez CSE 240C: Advanced Microarchitecture
- Prof. Steven Swanson
Program Analysis Jose Lugo-Martinez CSE 240C: Advanced - - PowerPoint PPT Presentation
Program Analysis Jose Lugo-Martinez CSE 240C: Advanced Microarchitecture Prof. Steven Swanson Outline Motivation ILP and its limitations Previous Work Limits of Control Flow on Parallelism Authors Goal Abstract Machine Models Results
Jose Lugo-Martinez CSE 240C: Advanced Microarchitecture
Motivation
ILP and its limitations Previous Work
Limits of Control Flow on Parallelism
Author’s Goal Abstract Machine Models Results & Conclusions
Automatically Characterizing Large Scale Program Behavior
Author’s Goal Finding Phases Results & conclusions
Register renaming Alias analysis Branch prediction Loop unrolling
1 branch every 5 instructions Latencies of units: many operations must be scheduled Increase ports to Register File (bandwidth) Increase ports to memory (bandwidth) …
parallelism = # of instr / # cycles required
The average parallelism is around 7, the median around 5.
The average parallelism is close to 9, but the median is still around 5.
Motivation: Much more parallelism is available on an oracle machine, suggesting that the bottleneck in Wall’s experiment is due to control flow Goal: Discover ways to increase parallelism by an order of magnitude beyond current approaches How?
They analyze and evaluate the techniques of speculative execution, control dependence analysis, and following multiple flows of control
Expectations?
Hopefully establish the inadequacy of current approaches in handling control flow and identify promising new directions
Need to “take our best shot” at predicting branch direction. A common technique to improve the efficiency of speculation is to
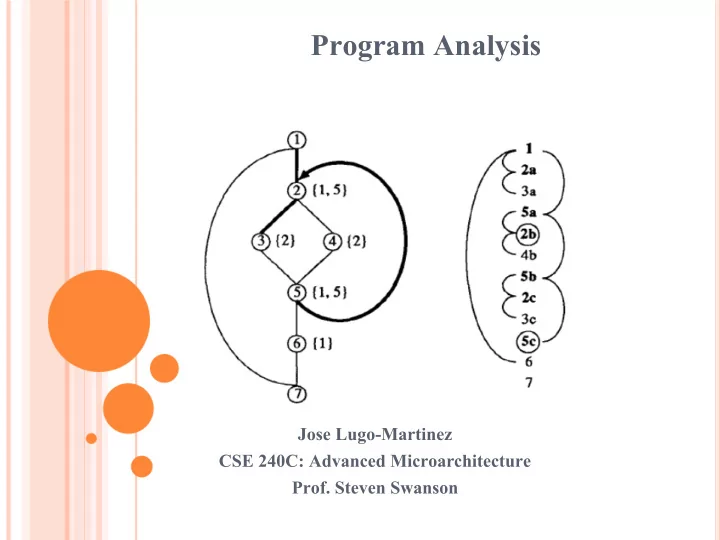
b = 1 is control dependent on the condition a < 0 c = 2 is control independent branch on which an instruction is control dependent is the control dependence branch Control dependence in programs can be computed in a compiler using the reverse dominance frontier algorithm
In the example above, control dependence analysis shows that the bar function can run concurrently with the preceding loop However, a uniprocessor can typically only follow one flow of control at any time Support multiple flows of control is necessary to fully exploit the parallelism uncovered by control dependence analysis Multiprocessor architectures are a general means of providing this support Each processor can follow an independent flow of control
Parallelism for the CD machine is primarily limited by the constraint that branches must be executed in order. The constraints for the CD-MF machine only require that true data and control dependence be observed, the parallelism for this machine is a limit for all systems without speculative execution.
Parallelism for the CD machine is primarily limited by the constraint that branches must be executed in order. The constraints for the CD-MF machine only require that true data and control dependence be observed, the parallelism for this machine is a limit for all systems without speculative execution.
These results are comparable to Wall’s results for a similar machine
Motivation: Programs can have wildly different behavior over their run time, and these behaviors can be seen even on the largest
unlock many new optimizations Goals: To create an automatic system that is capable of intelligently characterizing time-varying program behavior To provide both analytic and software tools to help with program phase identification To demonstrate the utility of these tools for finding places to simulate How: Develop a hardware independent metric that can concisely summarize the behavior of an arbitrary section of execution in a program
Enables building the high level model
Tracks the code that is executing Long sparse vector Based on instruction execution frequency
ID: 1 2 3 4 5 . BB Exec Count: <1, 20, 0, 5, 0, …> weigh by Block Size: <8, 3, 1, 7, 2, …> = <8, 60, 0, 35, 0, …> Normalize to 1 = <8%,58%,0%,34%,0%,…>
Detailed simulation on SPEC takes months Cycle level effects can’t be ignored
Perform phase analysis For each phase in the program
Pick the interval most representative of the phase This is the SimPoint for that phase
Perform detailed simulation for SimPoints Weigh results for each SimPoint
According to the size of the phase it represents
Replaces virtually all the analysis and scheduling HW Replaces some analysis HW Rearranges the code to make the analysis and scheduling HW more successful Role of compiler Performed by compiler Performed by HW Performed by HW Scheduling Performed by compiler Performed by HW Performed by HW Independences analysis Performed by compiler Performed by compiler Performed by HW Dependences analysis VLIW Dataflow Superscalar Typical kind of ILP processor Minimally, a partial list of
specification of when and where each operation to be executed Specification of dependences between
None Additional info required in the program Independence Architectures Dependence Architecture Sequential Architecture