Profitability Ratio Analysis Profitability Ratios Purpose: - - PDF document

profitability ratio analysis profitability ratios
SMART_READER_LITE
LIVE PREVIEW

Profitability Ratio Analysis Profitability Ratios Purpose: - - PDF document

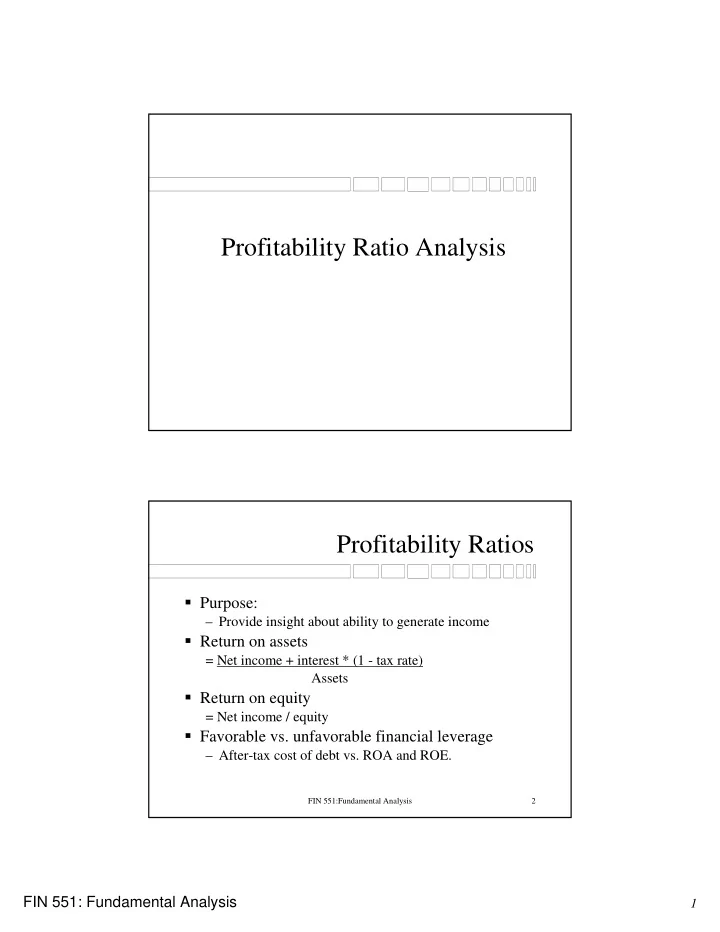
Profitability Ratio Analysis Profitability Ratios Purpose: Provide insight about ability to generate income Return on assets = Net income + interest * (1 - tax rate) Assets Return on equity = Net income / equity Favorable


slide-1
SLIDE 1

FIN 551: Fundamental Analysis

1

Profitability Ratio Analysis

FIN 551:Fundamental Analysis 2

Profitability Ratios

Purpose:

– Provide insight about ability to generate income

Return on assets

= Net income + interest * (1 - tax rate) Assets

Return on equity

= Net income / equity

Favorable vs. unfavorable financial leverage

– After-tax cost of debt vs. ROA and ROE.

slide-2
SLIDE 2

FIN 551: Fundamental Analysis

2

FIN 551:Fundamental Analysis 3

Return on Equity

Simply stated:

ROE = Net income / equity

Fails to reveal underlying factors

» What is the contribution of operating activity to profitability? » Can asset management improve profitability? » Has debt financing provided favorable leverage? » How have income taxes impacted profitability? » What is the influence of non-operating activities on profitability? » Can the firm sustain its current level of growth?

Decompose to obtain an understanding.

FIN 551:Fundamental Analysis 4

DuPont ROE

Decompose: ROE = Net income / equity Into:

ROE = Return on sales * Asset turnover * Financial leverage

Analyze trends in the components Critically examine both “good” and “bad” performance.

slide-3
SLIDE 3

FIN 551: Fundamental Analysis

3

FIN 551:Fundamental Analysis 5

Extended DuPont Analysis

Operations via a common-size analysis Asset turnover Financial leverage

– Interest expense – Debt vs. equity proportions in the balance sheet

Tax effect Unusual items effect Discuss using handout example.

FIN 551:Fundamental Analysis 6

Common-Size Income Statement

Usefulness:

– Are the company’s margins consistent with its stated competitive strategy? – Are the company’s margins changing? Why? What are the underlying causes? – Is the company managing its overhead and administrative costs well? What are the activities driving these costs? Are the activities necessary?

slide-4
SLIDE 4

FIN 551: Fundamental Analysis

4

FIN 551:Fundamental Analysis 7

Efficiency in Managing Assets

Detailed analysis reveals effectiveness of investment management

– Use turnover ratios

Two primary areas:

– Net working capital management

» Receivables, inventory, payables » Support normal operations

– Long-term asset management

» Assets generate long-term earnings.

FIN 551:Fundamental Analysis 8

Turnover Ratios

Purpose:

– Measure efficiency in managing assets

Definition:

– Sales / asset

A slight digression:

» Assume total assets = Cash + receivables + inventory + fixed assets $1,000 = $100 + $300 + $200 + $400 & sales = $5,000

Calculate turnover ratio for each component

Questions:

» Are the ratios additive for the components? » Interpretations?

slide-5
SLIDE 5

FIN 551: Fundamental Analysis

5

FIN 551:Fundamental Analysis 9

Net Working Capital Management

Net current assets / sales

= (Cash + marketable securities) / sales

+ Accounts receivable / sales + Inventories / sales + Prepaids / sales

  • Accounts payable & accruals

1 / (Net current assets / sales) = Sales / net current assets = Turnover of net current assets.

FIN 551:Fundamental Analysis 10

Turnover: Receivables Issues

How well does the company manage its credit policies? Are these policies consistent with its marketing strategy? Is the company artificially increasing sales by loading distribution channels?

slide-6
SLIDE 6

FIN 551: Fundamental Analysis

6

FIN 551:Fundamental Analysis 11

Turnover: Inventory Issues

How well does the company manage its inventory? Does the company use modern manufacturing techniques? What is the underlying business reason for change in inventory ratios? Are new products being planned? Is there a mismatch between demand forecasts and actual sales?

FIN 551:Fundamental Analysis 12

Long-Term Asset Management

Long-term assets / sales = Gross fixed assets / sales

  • Accumulated depreciation / sales

+ Other long-term assets / sales 1 / (Long-term assets / sales) = Sales / long-term assets = Turnover of long-term assets.

slide-7
SLIDE 7

FIN 551: Fundamental Analysis

7

FIN 551:Fundamental Analysis 13

Long-Term Investment Issues

Is investment in plant and equipment consistent with the competitive strategy? Does the company have a sound policy of acquisitions and divestitures? How is product quality affected? What is the estimated age of the assets?

» Gross fixed assets / depreciation expense » Accumulated depreciation / depreciation expense » Net fixed assets / depreciation expense.

FIN 551:Fundamental Analysis 14

Operating Return on Assets

Operating return on assets before taxes is:

– EBIT / assets

It is also the product of:

– Operating return on sales = EBIT / sales – Asset turnover ratio = Sales / assets

Note:

– All financing costs are excluded from EBIT – Taxes have been excluded from EBIT

» Show a separate tax effect later.

slide-8
SLIDE 8

FIN 551: Fundamental Analysis

8

FIN 551:Fundamental Analysis 15

Financial Leverage Effect

Financial leverage increases ROE if rate of return earned on the invested funds > cost of debt financing However, financial leverage increases risk of financial distress Debt obligations have priority over equity payments Financial leverage consists of two components

» Interest expense multiplier » Balance sheet financing multiplier

FIN 551:Fundamental Analysis 16

Interest Expense Multiplier

Defined as:

1 - (interest expense) / (operating earnings)

  • r as 1 - (interest expense) / EBIT
  • r as (EBIT - interest expense) / EBIT
  • r as EBT / EBIT

Interpretation:

– The proportion of $1 of operating earnings (before interest expense) that is left after paying interest.

slide-9
SLIDE 9

FIN 551: Fundamental Analysis

9

FIN 551:Fundamental Analysis 17

Balance Sheet Financing Multiplier

Financial leverage = Assets / equity But, Assets = Debt + Equity Thus, Assets / equity = (Debt / equity) + 1 Assets / equity = Current liabilities / equity + Long-term debt / equity + Other LT liabilities / equity + Preferred stock / equity + 1.

FIN 551:Fundamental Analysis 18

Joint Financial Leverage Effect

Defined as the product of:

– Interest expense multiplier – Balance sheet financing multiplier

Interpretation of joint effect:

– Positive financial leverage if product > 1 – Negative financial leverage if product < 1.

slide-10
SLIDE 10

FIN 551: Fundamental Analysis

10

FIN 551:Fundamental Analysis 19

W.T. Grant’s Management of Financial Leverage

1974 1973 1972 1971 1970 Assets/Equity 3.962 3.410 2.983 2.762 2.531 CL/Equity 1.761 1.544 1.145 1.246 1.025 LTL/Equity 0.697 0.389 0.406 0.110 0.127 Other/Equity 0.480 0.451 0.403 0.373 0.338 Preferred/Equity 0.024 0.026 0.029 0.033 0.041 Equity/Equity 1.000 1.000 1.000 1.000 1.000 Accounting identity: Assets = Liabilities + equity

FIN 551:Fundamental Analysis 20

W.T. Grant’s Interest Rate Environment

1 2 3 4 5 6 7 8 9 2 4 6 8 10 12 14 16 18 20

Years %

  • Jan. ‘70
  • Jan. ‘74
  • Jan. ‘73
  • Jan. ‘69
  • Jan. ‘71
  • Jan. ‘72
slide-11
SLIDE 11

FIN 551: Fundamental Analysis

11

FIN 551:Fundamental Analysis 21

Income Tax Multiplier

Income tax multiplier

– Defined as: 1 - (income tax) / (pretax income)

  • r as (EBT - income taxes) / EBT
  • r as NI / EBT

Interpretation

– The proportion of $1 of pretax income left after paying income tax.

FIN 551:Fundamental Analysis 22

ROE: Excluding Unusual Items

ROE is the product of:

– Operating return on sales – Asset turnover ratio – Joint interest & financial leverage multiplier – After income tax multiplier

By excluding unusual items

– Better fix on profitability of normal operations.

slide-12
SLIDE 12

FIN 551: Fundamental Analysis

12

FIN 551:Fundamental Analysis 23

Effect of Unusual Items

Restructuring charges, extraordinary gains/losses, etc... can seriously change ROE Adjusting ROE for these items lets you see the impact of nonrecurring items Although not unusual, an adjustment for preferred dividends is necessary

– Why?

» Preferred shareholders are not residual owners of the business.

FIN 551:Fundamental Analysis 24

Background for Sustainable Growth

Sustainable growth relies on: Return on equity Dividend policy.

slide-13
SLIDE 13

FIN 551: Fundamental Analysis

13

FIN 551:Fundamental Analysis 25

Sustainable Growth

Definition:

– Growth the firm can sustain

» Without issuing new equity » Maintaining current financial policies

Based on “sources” = “uses” concept Formula:

Growth = Retention ratio * ROE . 1 - (Retention ratio * ROE)

Compare: Sustainable growth vs. actual growth.

FIN 551:Fundamental Analysis 26

An Example

LY TY LY TY Assets 200 330 Sales 400 700 Debts 40 80 Costs 300 550 Equity 160 250 Profit 100 150 Sales growth = 75% Dividends 40 60 Asset growth = 65% Retained 60 90

Growth = Retention ratio * ROE . 1 - (Retention ratio * ROE) = .60 x .625/[1 - .60 x .625] 60.0% = .60 x .60/[1 - .60 x .60] 56.3%

slide-14
SLIDE 14

FIN 551: Fundamental Analysis

14

FIN 551:Fundamental Analysis 27

W.T. Grant’s Sustainable Growth

1974 1973 1972 1971 1970 Return on sales .004 .023 .025 .031 .034 Inverted asset turnover .677 .675 .687 .644 .584 Financial leverage 2.962 2.410 1.983 1.762 1.531 Retention rate

  • 1.542 .444 .402 .477 .532

Sustainable growth

  • .038 .054 .046 .068 .085

Actual growth (sales) .125 .196 .096 .036 .096

Formula: Sustainable growth = ROS * Retention Rate * Assets/Equity . Assets/Sales - ROS * Retention Rate * Assets/Equity

FIN 551:Fundamental Analysis 28

Inflation-Adjusted Statements

Important considerations:

– Inflation sensitivity of assets and liabilities – Old assets vs. relatively new assets – Price vs. volume gains – Productivity gains?

slide-15
SLIDE 15

FIN 551: Fundamental Analysis

15

FIN 551:Fundamental Analysis 29

W.T. Grant’s Inflation Management Performance

As Reported Adjusted Sales 1,849,802 1,849,802 Cost of sales 1,163,998 1,300,000 Depreciation 13,579 17,282 Other expenses 623,646 623,646 Operating earnings 48,579

  • 91,126

Interest expense 7,033 7,033 Taxes 787 787 Net income 3,778

  • 135,927

Dividends 21,122 21,122 Retained earnings

  • 12,693
  • 152,398

FIN 551:Fundamental Analysis 30

The End