
SLIDE 1
14th IAHR Conference – December 2009
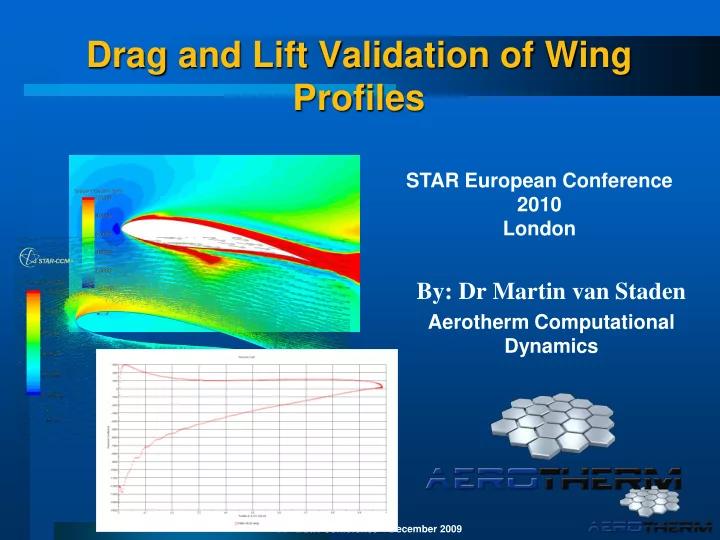
Drag and Lift Validation of Wing Profiles
By: Dr Martin van Staden
Aerotherm Computational Dynamics STAR European Conference 2010 London
Profiles STAR European Conference 2010 London By: Dr Martin van - - PowerPoint PPT Presentation
Drag and Lift Validation of Wing Profiles STAR European Conference 2010 London By: Dr Martin van Staden Aerotherm Computational Dynamics 14 th IAHR Conference December 2009 Outline of Presentation Background Detailed Fan
14th IAHR Conference – December 2009
Aerotherm Computational Dynamics STAR European Conference 2010 London
STAR European Conference 2010
Background Detailed Fan Modelling 2-D Wing Section Modelling Comparison with Experimental data Mesh & Turbulence model sensitivity Summary & Conclusions
STAR European Conference 2010
Two large Coal fired power stations are currently being
These ACC’s Consist of 384 fans each with a diameter
Detailed fan modelling
STAR European Conference 2010
CFD provides us with the ideal tool
to model an ACC in order to understand the complex flows around as well as within the ACC’s A-frames.
One of the most important parts of the
ACC modelling process is to understand how the fans react to poor inflow conditions.
Fan performance can therefore be analysed as they will be installed
in situ and tested under real operating conditions.
This data can then be used in global ACC models to model the entire
ACC in order to evaluate it’s response to changing wind conditions.
An important outcome of the CFD analysis is the predicted fan power
for a given blade angle setting.
STAR European Conference 2010
Requirements for fan modelling Global ACC model:
– Must predict the volume flow rate accurately – Must represent system pressure losses accurately – Must take into account the affect flow rate as a function of varying pressure losses – Must take into account the affect of skewed inflow conditions – Must be able to accurately predict fan power consumption
Accurate prediction of the Fan power is important as
STAR European Conference 2010
What is a detailed fan model?
– The fan blades are explicitly modelled – Fan is rotated (explicitly or implicitly) – Cell sizes as small as 1mm – All support structures such as the A-frame, I-beams, fan screen supports, steam ducts, fan bridge, motor and gearbox, fan inlet bell etc are explicitly modelled.
STAR European Conference 2010
The lift and drag is explicitly calculated based on the
Rotation is achieved through steady state MRF or
A test facility was modelled in order to compare the
STAR European Conference 2010
Good agreement was found with Pressure
Power was over predicted by the CFD models by more than 11%
STAR European Conference 2010
Tests were conducted on 2D wing sections in order to
The aim of the study was to identify which modelling
STAR European Conference 2010
The laser scanned fan wing section profile was
Prof. Ewald Krämer from Stuttgart University was kind
STAR European Conference 2010
Low Rey poly mesh (15 boundary layer cells) No wake refinement
STAR European Conference 2010
Free stream velocity of 50m/s was used (Rey=1.94E+6) Inlet turbulence intensity of 0.01 Turbulent viscosity ratio of 10 Used all y+ approach in all turbulence models where this
STAR European Conference 2010
STAR European Conference 2010
FX60-126 - Aerofoil data Cl from CFD 2D profile simulation
0.00 0.50 1.00 1.50 2.00
5 10 15 20 25 Angle of attack (α) Lift Coefficien Cl Cl CFD Coarse k-e Cl Stuttgart : FX 60-126 - Rey=2e6
Stall point
STAR European Conference 2010
FX60-126 - Aerofoil data Cl and Cd from CFD 2D profile simulation
0.01 0.02 0.03 0.04 0.05 0.06
5 10 15 20 25
Angle of attack (α) Drag Coefficient Cd
Cd CFD Coarse k-e Cl Stuttgart : FX 60-126 - Rey=2e6
STAR European Conference 2010
STAR European Conference 2010
STAR European Conference 2010
10º 15º Onset of stall
STAR European Conference 2010
FX60-126 - Aerofoil data Cl and Cd from CFD 2D profile simulation
0.00 0.50 1.00 1.50 2.00 2.50
5 10 15 20 25 Angle of attack (α) Lift Coefficien Cl Cl CFD Coarse k-e Cl Stuttgart : FX 60-126 - Rey=2e6 k-e low Rey mesh k-w low Rey mesh Spalat-Almaris RS-2l k-e_V2-f k-w_trans
10º 15º
STAR European Conference 2010
FX60-126 - Aerofoil data Cl and Cd from CFD 2D profile simulation
0.01 0.02 0.03 0.04 0.05 0.06
5 10 15 20 25
Angle of attack (α) Drag Coefficient (Cd)
Cd CFD Coarse k-e Cl Stuttgart : FX 60-126 - Rey=2e6 k-e low Rey mesh k-w low Rey mesh-refine1 Spalat-Almaris RS-2l k-e_V2-f k-w_trans
10º 15º
STAR European Conference 2010
Pressure Coefficient
5000 0.1 0.2 0.3 0.4 0.5 0.6 0.7 0.8 0.9 1
Position (m) Skin Friction Coef. k-e low rey k-w Spalat-Almaris RST_2l k-e v2f
STAR European Conference 2010
Skin Friction Coefficient
50 100 150 200 250 300 0.1 0.2 0.3 0.4 0.5 0.6 0.7 0.8 0.9 1
Position (m) Skin Friction Coef. k-e low rey k-w Spalat-Almaris RST_2l k-e v2f
STAR European Conference 2010
Pressure vs. Shear drag @ 10deg & 15deg angle of attack
0% 20% 40% 60% 80% 100% 120% k-e low Rey mesh RS_2l k-e_V2-f k-w low Rey mesh k-w_sst Spalat-Almaris
15deg Pressure 15deg Shear 10deg Pressure 10deg Shear
Pressure Shear 10 deg Average 68% 32% 15 deg Average 86% 14%
STAR European Conference 2010
On average at 15º angle of attack the drag due to
This leads one to suspect that the pressure drag may
Further mesh refinement studies could confirm
Better definition of the profile geometry could reduce
Sensitivity to inlet turbulence
STAR European Conference 2010
Lift and stall point are predicted with a high degree of
Drag however is highly over predicted with all
Further work has to be performed on mesh sensitivity
Experimental work is underway at Universities to
14th IAHR Conference – December 2009
14th IAHR Conference – December 2009
STAR European Conference 2010
FINE MESH (5.3 million cells) COARSE MESH (1.7 million cells)