
SLIDE 1
Prince of Wales Alaska Economy Prepared for the Chamber Rain - - PowerPoint PPT Presentation
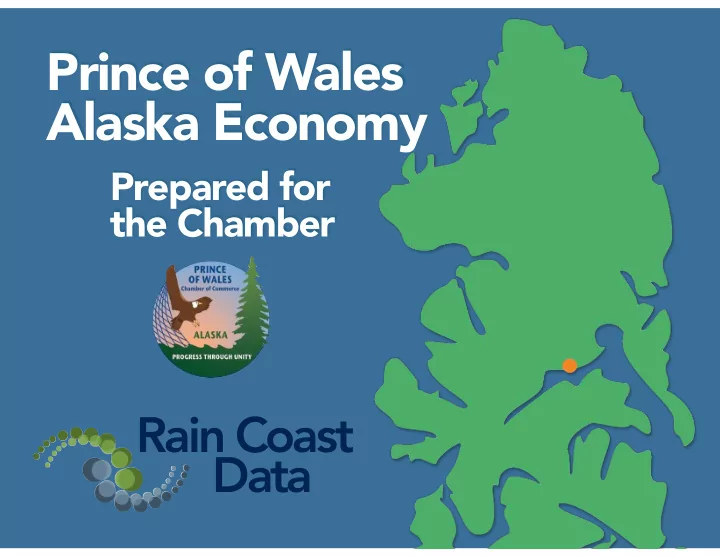
Prince of Wales Alaska Economy Prepared for the Chamber Rain Coast Data Prince of Wales 4,200 people 3rd largest island in US 97th largest in world 10% of Southeast AK 12 communities 2,000 miles road Changes in
4,200 people 3rd largest island in US 97th largest in world 10% of Southeast AK 12 communities 2,000 miles road
1959 1994 2007 2012 2015
Changes in Southeast Alaska: 1960 to 2015
3 5
Y E A R S
1 3
Y E A R S
5 YEARS
3
Y E A R S
Changes in Southeast Alaska: The Last 5 Years Population +2,900 +4% Labor force +1,500 +3% Job Earnings + $275 million +14%
Changes in POW Alaska: The Last 5 Years Population +230 +5% Labor force +205 +15% Job Earnings + $19 million (+24%)
Changes in Southeast Alaska: The Last Year Population
Workforce
Job Earnings + $34.6 million (+1.6%)
Changes in Prince of Wales: The Last Year Population
Workforce
Job Earnings
1998 1999 2000 2001 2002 2003 2004 2005 2006 2007 2008 2009 2010 2011 2012 2013 2014 2015
4,207 4,212 4,227 4,239 4,271 4,012 4,083 4,030 4,004 4,105 4,101 4,201 4,208 4,253 4,364 4,653 4,896 5,103
4,207 People (-24 last year)
Photo Credit: Carolyn Chapman.
Median Age
POW=40.5 AK=34.4
21% POW Residents 60+
Photo Credit: Carolyn Chapman.
Mining 5%
Other 6% Trade 7% Construction 7% Visitors 9% Seafood 12% Government 35%
Private Health Care 6% F i n a n c i a l A c t i v i t i e s 5 % Professional Services 6% Mining 4% Social, Info, Timber 4%
2014 Southeast Alaska Employment Earnings
45,700 Jobs $2.2 billion
Mining 5%
Trade 10% Construction 6% Visitors 9% Timber 12% Seafood 19% Government 31%
Heath Care & Social 6% Other 4% Other Maritime 4%
Prince of Wales Island Employment Earnings
1,935 Jobs $78 million 4% of all SE wages and jobs
Federal Gov't Seafood State Gov't Timber Construction Other Maritime Health & Social Services Local Gov't Trade Tourism Other Average 17500 35000 52500 70000
$40,386 $29,098 $30,838 $31,036 $32,996 $36,725 $41,655 $46,839 $52,623 $53,553 $64,948 $65,773
Earnings by Industry
Local 25%
Government wages = 31% of all employment earnings last year
Federal 4% S t a t e 2 %
Federal 52 State 33 Local 581
16 Million Pounds of Seafood 2015 (Landed on Prince of Wales only)
Other Salmon 39%
Crab and Halibut <1%
Pink Salmon 57%
Other 2% G e
u c k 2 %
Photo Credit: Carolyn Chapman.
16 Million Pounds
Other 12% Geoduck 17% Other Salmon 50%
Pink Salmon 17%
$11 Million
Halibut 4%
Other Salmon 39%
Halibut <1%
Pink Salmon 57%
Other 2% G e
u c k 2 %
2006 2007 2008 2009 2010 2011 2012 2013 2014 2015
Nominal Ex-Vessel Value (millions) Landed Pounds (millions)
16 15 5 3 3 3 5 3 8 4
$11 $12 $11 $10 $11 $11 $7 $9 $8 $8 $8 $8 $9 $7 $11 $11 $10 $11 $12 $11
VALUE & POUNDS OF SEAFOOD LANDED IN PRINCE OF WALES 2006 TO 2015 310 to 395 vessels
Maritime as a % of all private sector earnings
35% 22% 11%
POW SE Alaska Alaska
470 1,125 2,250 3,375 4,500
1983 1985 1987 1989 1991 1993 1995 1997 1999 2001 2003 2005 2008 2010 2012 2014
Jobs Board Feet Cut
53% of all SE timber jobs
Island Jobs Associated With Viking Lumber
Primary Uses of Viking’s Lumber
Photo Credit: Carolyn Chapman.
Ferry Air Small Cruise
7,500 15,000 22,500
1,000 13,500 22,100
Photo Credit: Carolyn Chapman.
Other 4%
Includes a LOT of things, including mining
2008 2009 2010 2011 2012 2013 2014 2015
Gold Rare Earth
Declining State Government
POW Only: Rate your level of concern about how the State budget crisis will impact your:
Region Community Industry Business 0% 25% 50% 75% 100% 20% 44% 36% 54% 20% 22% 43% 46% Significantly concerned Maximum concern
What actions will ensure the economic resilience of your business/ industry/community?
57 comments from POW
Increase economic development
Reduce government spending/services
Increase Taxes: Instate Income Tax Oil Tax Change Other New Taxes
6 Increase communication with government/elected officials 7 Change use of permanent fund earnings to pay for state costs
2
3
4
8 Diversify economy 9 Make region more attractive 10 Natural resource development
13 Build roads12 Invest in education
14 Increase private land holdings11 Focus on tourism
Resiliency Mapping (Font size = number of responses) What actions will Southeast Alaskan community and business leaders implement or advocate for to ensure the economic resilience
and communities in response to the impacts
What will Southeast Alaskans Do?
5 Maintain ferry services
Top Benefits
How Significant are These Elements to Operating Your Business in Prince of Wales?
Overall Quality
Recreational Opportunities Cultural Opportunities Access to Natural Resources
0% 20% 40% 60% 80%Moderate benefit Significant benefit
77% 70% 48% 28%
Hoonah-Angoon Area Skagway Ketchikan Haines Juneau Petersburg Wrangell Sitka Prince of Wales
$4,750 $8,500$1,879 $4,046 $4,629 $4,842 $5,009 $7,464 $7,789 $8,440 $8,975
AVERAGE PROFIT OF INDEPENDENT SE ARTISTS, 2013 (Regional Average = $5,105)
Top Barriers
How Significant are These Elements to Operating Your Business in Prince of Wales?
Cost of transportation (freight) Overall cost of business Cost of transportation (people) Federal regulations Local suppliers for your business Availability of worker pool The cost of electricity State regulations
0% 25% 50% 75%Moderate barrier Significant barrier
86% 72% 60% 62% 85% 57% 60% 59%
Banks Other businesses in your industry Economic Development Organizations Local Government State Government Environmental Organizations Federal Government Industry Associations/Chambers Regional University (UAS, UAF Programs) Tribal Government/Alaska Native Entities Business Assistance Centers Professional Service Firms
0% 17.5% 35% 52.5% 70%Valuable Extremely valuable
55%
Southeast Alaska Land Ownership Circle size = Number of Acres
THE FEDERALLY-MANAGED TONGASS MAKES UP NEARLY 4/5TH OF ALL SOUTHEAST
16% OTHER FEDERAL
ALASKA NATIVE
3.4% 2.5% STATE OF ALASKA 0.25% TOWNS
0.05% PRIVATE LAND
OWNERS
$52.2 Million Economic Impact in 2015 The total economic impact of the IFA in Ketchikan was $21.6 million The total economic impact of the IFA in Prince of Wales was $19.4 million Shared seafood impact $11.2 million
50,500 people and 12,000 vehicles travel between Ketchikan and Prince
annually.
$52.2 Million Economic Impact in 2015
$52.2 Million Economic Impact in 2015
320 island jobs and $7.1 million in wages are dependent on the IFA
IFA Tourism
2,265 summer tourists and 800 Ketchikan hunters came to POW on the IFA, accounting for 3,000 visitors. They stayed an average of 12.7 days. 79% came to Prince of Wales by ferry to fish. Visitors spent $10.2 million in Prince of Wales on hotels, food, activities, etc. for a total economic impact of $14 million. Tourists generated 213 peak summer visitor industry jobs with an associated payroll of $1.7 million (including secondary jobs).
Fished Salt water fishing Fresh water fishing Hiked Camped Hunt Cave Kayaked Cycled 0.2 0.4 0.6 0.8
3% 8% 8% 14% 17% 32% 41% 71% 79%
What did you do (or plan to do)?
Craig Klawock Hollis Coffman Thorne Bay Whale Pass Naukati Hydaburg Kasaan Port Protection Edna Bay Point Baker 0.2 0.4 0.6 0.8
1% 2% 2% 6% 12% 13% 20% 35% 36% 47% 60% 73%
Where did you go (or plan to go)?
With Family/Friends Cabin Camped Resort Hotel B&B RV Bunkhouse On Boat 0.075 0.15 0.225 0.3
3% 4% 6% 7% 11% 12% 14% 17% 26%
Where did you stay?
Friends or Family Cabin or Bunkhouse Hotel or B&B Camped Resort RV Other 150 300 450 600
75 125 270 330 400 475 590
Where did you stay? Estimated Visitors
20 bear hunters
RV Cabin or Bunkhouse Camped Friends or Family Hotel or B&B Resort Other Average Workers Ketchikan Hunters 12.5 25 37.5 50
5.6 21.0 12.7 17.3 6.7 6.8 12.4 17.3 20.4 46.7
How long did you stay (in days)?
Estimated Spending in Millions
Cabin or Bunkhouse Resort Hotel or B&B Camped RV Friends or Family Other 0.6 1.2 1.8 2.4
$0.3 $1.1 $1.2 $1.2 $1.3 $2.1 $2.2
Estimated Spending per IFA Tourist
Where are you from?
WA OR AK CA UT MT ID WY OK CO MN East Coast International 25 random other states 0.075 0.15 0.225
15% 2% 5% 2% 2% 2% 2% 3% 4% 5% 8% 13% 15% 22%
Road System Trails Boat Launches Cave Camp Grounds Cabins 0.15 0.3 0.45 0.6
15% 20% 26% 27% 36% 60%
Which Forest Service facilities did you use?
For those reporting “Yes”
Photo Credit: Carolyn Chapman.