
SLIDE 1
Failure-cause sed Traffic Conflicts s – Theory, Applications s and Validation
Vision zero for traffic fatalities and serious injuries – research questions and challenges 32ndICTCT Conference in Warsaw, Poland 24– 25October 2019 Andrew Tarko, PhD Professor of Civil Engineering Director of Center for Road Safety Purdue University, Lyles School of Civil Engineering West Lafayette, Indiana, USA
Primer to Traffic Conflicts
(Near-crash Events)
- https://www.youtube.com/watch?v=wo_u5Ncv-Ko (right angle)
- https://www.youtube.com/watch?v=HIRKH6MtY2Y (side swipe)
- https://www.youtube.com/watch?v=XLbfJ3ocjnA (rear end)
- https://www.youtube.com/watch?v=8SeVc3itItI (pedestrian)
Connecting Crashes with Conflicts
Frequentist st A Approach
- Observe traffic conflicts in relatively short periods on multiple roads
- Use corresponding crashes reported on the same roads in similar
conditions in long periods
- Calculate crash-conflict ratio, or
- Estimate a crash count regression model that includes traffic conflicts
Causality not considered Conditions in the two periods different Underreporting crashes by police Transferability of the ratio questionable
- Understand the mechanism of crash occurrence
- Propose a conflict model that includes the causal
mechanism of unobserved crashes
- Estimate the model using conflicts data
- Validate the model
Connecting Crashes with Conflicts
Counterfactual A Approach
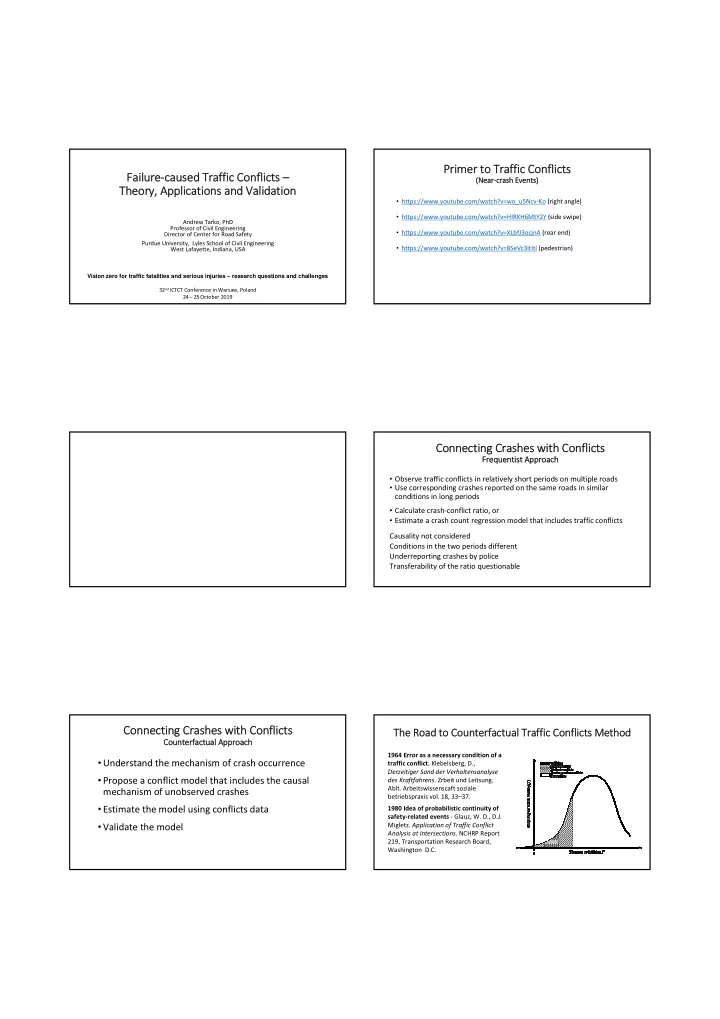
The Road to Counterfactual Traffic Conflict cts Method
1964 Error as a necessary condition of a traffic conflict. Klebelsberg, D., Derzeitiger Sand der Verhaltensanalyse des Kraftfahrens. Zrbeit und Leitsung.
- Ablt. Arbeitswissenscaft soziale
betriebspraxis vol. 18, 33–37. 1980 Idea of probabilistic continuity of safety-related events - Glauz, W. D., D.J.
- Migletz. Application of Traffic Conflict