SLIDE 1
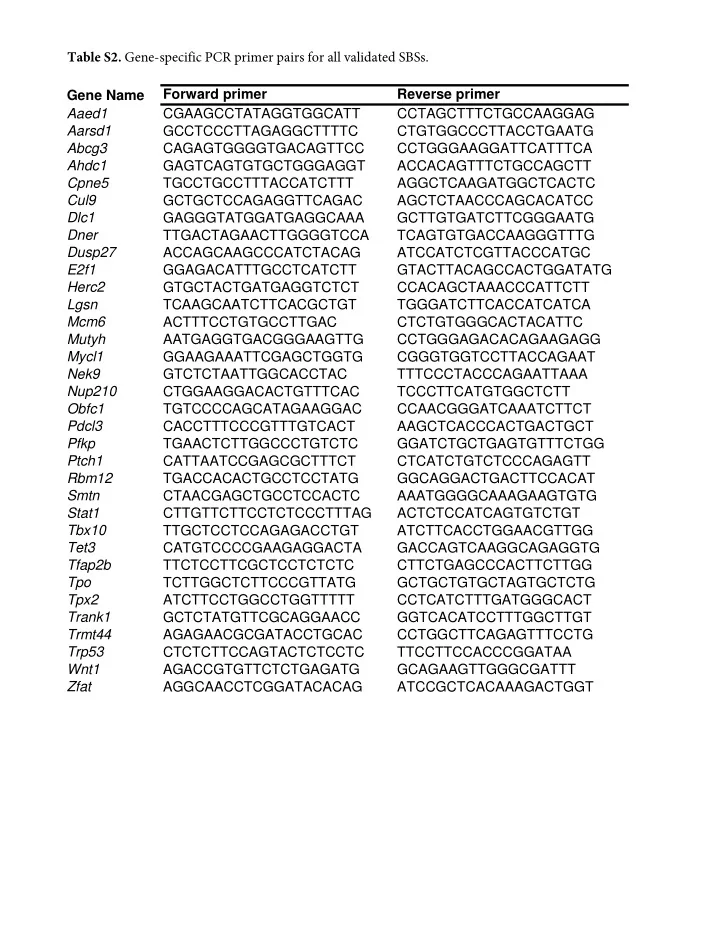
Gene Name Forward primer Reverse primer Aaed1 CGAAGCCTATAGGTGGCATT CCTAGCTTTCTGCCAAGGAG Aarsd1 GCCTCCCTTAGAGGCTTTTC CTGTGGCCCTTACCTGAATG Abcg3 CAGAGTGGGGTGACAGTTCC CCTGGGAAGGATTCATTTCA Ahdc1 GAGTCAGTGTGCTGGGAGGT ACCACAGTTTCTGCCAGCTT Cpne5 TGCCTGCCTTTACCATCTTT AGGCTCAAGATGGCTCACTC Cul9 GCTGCTCCAGAGGTTCAGAC AGCTCTAACCCAGCACATCC Dlc1 GAGGGTATGGATGAGGCAAA GCTTGTGATCTTCGGGAATG Dner TTGACTAGAACTTGGGGTCCA TCAGTGTGACCAAGGGTTTG Dusp27 ACCAGCAAGCCCATCTACAG ATCCATCTCGTTACCCATGC E2f1 GGAGACATTTGCCTCATCTT GTACTTACAGCCACTGGATATG Herc2 GTGCTACTGATGAGGTCTCT CCACAGCTAAACCCATTCTT Lgsn TCAAGCAATCTTCACGCTGT TGGGATCTTCACCATCATCA Mcm6 ACTTTCCTGTGCCTTGAC CTCTGTGGGCACTACATTC Mutyh AATGAGGTGACGGGAAGTTG CCTGGGAGACACAGAAGAGG Mycl1 GGAAGAAATTCGAGCTGGTG CGGGTGGTCCTTACCAGAAT Nek9 GTCTCTAATTGGCACCTAC TTTCCCTACCCAGAATTAAA Nup210 CTGGAAGGACACTGTTTCAC TCCCTTCATGTGGCTCTT Obfc1 TGTCCCCAGCATAGAAGGAC CCAACGGGATCAAATCTTCT Pdcl3 CACCTTTCCCGTTTGTCACT AAGCTCACCCACTGACTGCT Pfkp TGAACTCTTGGCCCTGTCTC GGATCTGCTGAGTGTTTCTGG Ptch1 CATTAATCCGAGCGCTTTCT CTCATCTGTCTCCCAGAGTT Rbm12 TGACCACACTGCCTCCTATG GGCAGGACTGACTTCCACAT Smtn CTAACGAGCTGCCTCCACTC AAATGGGGCAAAGAAGTGTG Stat1 CTTGTTCTTCCTCTCCCTTTAG ACTCTCCATCAGTGTCTGT Tbx10 TTGCTCCTCCAGAGACCTGT ATCTTCACCTGGAACGTTGG Tet3 CATGTCCCCGAAGAGGACTA GACCAGTCAAGGCAGAGGTG Tfap2b TTCTCCTTCGCTCCTCTCTC CTTCTGAGCCCACTTCTTGG Tpo TCTTGGCTCTTCCCGTTATG GCTGCTGTGCTAGTGCTCTG Tpx2 ATCTTCCTGGCCTGGTTTTT CCTCATCTTTGATGGGCACT Trank1 GCTCTATGTTCGCAGGAACC GGTCACATCCTTTGGCTTGT Trmt44 AGAGAACGCGATACCTGCAC CCTGGCTTCAGAGTTTCCTG Trp53 CTCTCTTCCAGTACTCTCCTC TTCCTTCCACCCGGATAA Wnt1 AGACCGTGTTCTCTGAGATG GCAGAAGTTGGGCGATTT Zfat AGGCAACCTCGGATACACAG ATCCGCTCACAAAGACTGGT Table S2. Gene-specific PCR primer pairs for all validated SBSs.
SLIDE 2 Gene Name Sequencing Results Gene Function/Pathway Dlc1 in -/- 1 wk DMBA (unique to liver) Tumor suppressor, possibly acts via regulation of Wnt/β-catenin pathway Obfc1 unique to -/- 1 wk DMBA Promotes efficient replication of lagging-strand telomeric DNA Aarsd1 unique to -/- 4 wk DMBA Adenyl ribonucleotide binding Cul9 unique to -/- 4 wk DMBA Tumor suppressor that promotes p53-dependent apoptosis Rbm12 common to -/- liver ctrl and 4wk Nucleotide binding Cpne5 unique to -/- DMBA survivors Murine central nervous system development Lgsn unique to -/- DMBA survivors Structural role in lens Mutyh unique to -/- DMBA survivors DNA repair enzyme that protects cells from oxidative DNA damage and is critical for a proper cellular response to DNA damage Pfkp unique to -/- DMBA survivors AMPK signaling Tfap2b unique to -/- DMBA survivors Apoptotic death of neural crest progenitors Tpo unique to -/- DMBA survivors Cellular metabolic process Tpx2 unique to -/- DMBA survivors Overexpression associated with the development of different human tumors and strongly correlates with chromosomal instability Zfat unique to -/- kidney Cell survival Ahdc1 shared by all -/- kidney samples DNA binding Dusp27 common to all -/- kidney samples Metabolic process Aaed1 in cl6 (unique to kidney) No known function Abcg3 in cl6 (unique to kidney No known function Dner in cl6 (unique to kidney) Notch signaling Mycl1 in cl6 (unique to kidney) Apoptosis Pdcl3 in cl6 (unique to kidney) Angiogenesis and regulation of VEGFR-2 expression and function Tet3 in cl6 (unique to kidney) DNA demethylation Trank1 in cl6 (unique to kidney) No known function Trmt44 in cl6 (unique to kidney) No known function Nek9 common to kidney and lung tissue Component of replication stress response that promotes CHK1 activity Nup210 common to kidney and lung tissue Structural component of metazoan nuclear pores Stat1 common to kidney and lung tissue Regulates proliferation and differentiation; apoptosis Wnt1 common to kidney and lung tissue Wnt signaling Ptch1 in NS1 Shh receptor and negative regulator of the pathway E2f1 common to NS1 and NS4 Proliferation, migration and invasion Herc2 common to NS1 and NS4 Regulates BRCA1 stability in opposition to BARD1 Mcm6 common to NS1 and NS4 Important for helicase activity during DNA replication Smtn common to NS1 and NS4 Smooth muscle contractility Tbx10 common to NS1 and NS4 Exhibits a unique spatio-temporal pattern during hindbrain development Trp53 common to NS1 and NS4 Tumor suppression
Table S3. Table containing summary of validated SBSs and information about potentially interesting gene functions or role(s) of gene in signaling pathway(s). Sanger sequencing of amplification products validated 34 of 70 SBSs as true SBSs. ~8.5% (6/70) of the SBSs analyzed were confirmed as 129 SNPs.
SLIDE 3
Variants(Calling((Raw(Results( Removed(muta4ons(with(DP<10,(MQ<10,(QUAL<10;(removed(inser4ons/dele4ons;(removed(muta4ons:(1)(on(chromosomes(X(and( Y;(2)(labeled(“random”;(3)(duplicate;(4)(with(mul4ple(ALT(alleles;(5)(with(different(REF(alleles( Filtering)out)129)variants:( Removed(known(129(SNPs;(muta4ons(common(to:(1)(all(X/X(kidney(cell(lines(and(liver(4ssue(DNA(samples(not(found(in(+/+(kidney( cell(line(or(liver(4ssue(DNAs;(2)(muta4ons(common(to(both(X/X(NS1(and(NS4(cell(lines(and(1(or(more(X/X(4ssue(or(kidney(cell(line( DNAs(not(found(in(any(+/+(kidney(cell(line(or(liver(4ssue(DNAs( Filtering)out)possible)B6/dri8)muta:ons:( Removed(muta4ons(common(to:(1)(all(+/+(kidney(cell(line(and(liver(4ssue(DNAs(not(found(in(any(X/X(kidney(cell(line(or(liver(4ssue( DNAs;(2)(muta4ons(common(to(all(+/+(and(X/X(kidney(cell(lines(and(liver(4ssue(DNAs;(3)(muta4ons(common(to(a(+/+(and(1(or(more( X/X(4ssue(or(kidney(cell(line(DNAs(((
Figure S1. Flow chart illustrating filtration of exome sequence data. Filtering methods applied to variants calling raw
data to determine final number of SBSs used for exome sequence analysis of all +/+ and -/- cells/tissues.
SLIDE 4
Total
SBSs
%
of
specific
transi3ons/transversions
A B
0
100
200
300
400
+/+
‐/‐
‐/‐
clone
6
‐/‐
DMBA
survivors
0
10
20
30
40
50
60
C>A
C>G
C>T
T>A
T>C
T>G
+/+
‐/‐
‐/‐
clone
6
‐/‐
DMBA
survivors
Figure S2. Total SBS burden was calculated for exomes of laboratory passaged B6 +/+ and -/- kidney cultured cell lines sequenced by the EdgeBio facility (A). Frequencies of transitions (C>T, T>C) and transversions (C>A, C>G, T>A, T>G) were calculated for +/+ and -/- kidney cell lines (B).
SLIDE 5
Cul9
par-al
sequence
129
Fhit
‐/‐
4
week
DMBA
Figure S3. Partial chromatograms of confirmed Cul9 SBS in -/- 4 week DMBA liver tissue. Reference allele ‘C’ in 129 control DNA (top) and both reference ‘C’ and alternate ‘T’ alleles in -/- 4 week DMBA liver tissue DNA (bottom) were detected with Sanger sequencing of Cul9 amplification products. Forward and reverse reads are shown for both DNAs.