
SLIDE 1
Preview For Volunteers Balloon Fest is a Regional Interscholastic - - PowerPoint PPT Presentation
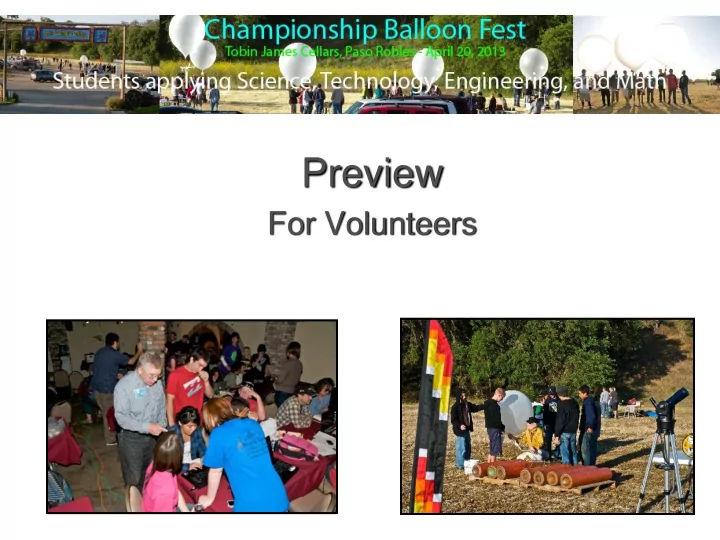
Preview For Volunteers Balloon Fest is a Regional Interscholastic STEM Event Teachers and teams of 3 to 6 students are invited to launch helium-filled, tethered balloons with student-designed instrumentation in order to measure different
Teachers and teams of 3 to 6 students are invited to launch helium-filled, tethered balloons with student-designed instrumentation in order to measure different characteristics of our atmosphere, or to test alternative engineering designs. After weeks of preparation, at an exciting all-day event, students will gather data, analyze it, and present their findings to peers, parents, and professionals. Enthusiastic adult mentors, judges, and event volunteers provide encouragement and active support for these student teams.
Levels of Participation Level 1 Introductory Designed for first time experimenters, ES or MS. Level 2 Intermediate Designed for high school STEM students Advanced Only for experienced experimenters and special projects
Hwy 46 and Union road
Mentor
Work with a team of great students by email and at the
you.
Judge
Evaluate readiness
interview teams at the event, and award prizes
Event Volunteer
Help with refreshments, registration, filling balloons, parking, or directions.
Team Support
Parents or friends of participating students help their team.
If you are not yet ready to participate
Come watch! Bring your family. The best time is from 8 to 10am.
Constant sound generator, microphone, oscilloscope with fourier analysis, printer and computer
One-way valve to allow air out will sample lowest pressure if T is const.
Two or three base stations, solid geometry, simultaneous measurements
Interesting perspective but also ability to measure altitude by apparent size of image
AIRSS: Crop Vigor
length & angle, Laser rangefinder, GPS, Trig, and plate scale. Precision & accuracy.
Inspire - Engage - Educate
1000 ft long elevation = 125,000 ft = 24 miles 6 hours flight 30 million cu. Ft. 5000 kg payload
≤ 2.2 kg payload ≤ 1000 ft AGL Size and duration unlimited ~$80 per balloon with multiple launches Payload mass and size limited Higher altitudes Short duration Expensive launches
Electronic Code of Federal Regulations Title 14: Aeronautics and Space
PART 101—MOORED BALLOONS, KITES, AMATEUR ROCKETS AND UNMANNED FREE BALLOONS
§ 101.1 Applicability. (1) Except as provided for in § 101.7, any balloon that is moored to the surface of the earth
than 115 cubic feet. § 101.7 Hazardous operations. (a) No person may operate any moored balloon, kite, amateur rocket, or unmanned free balloon in a manner that creates a hazard to other persons, or their property. (b) No person operating any moored balloon, kite, amateur rocket, or unmanned free balloon may allow an object to be dropped therefrom, if such action creates a hazard to
http://www.ecfr.gov
Hydrostatic pressure is the weight of the fluid above you. 14.7 lbs above every square inch (psi) 101,300 N above every square meter (Pa) Four Atmospheric Models: Isothermic P = P0 * exp (-h/h0 ) P0 = 101.3 kPa h0 = 8435 m Adiabatic Meteorological US Standard Atmosphere of 1976 Linear Approximation: h = k1 * P + k0 k1 = -307 ft/kPa = -93.4 m/kPa k0 = 30,900 ft = 9410m h1 = 2700 ft h2 = 3700 ft Error = 0.2% = 4 ft
| | | SL h1 h2 H (ft)
1— P (atm) P1— P2— 0—
Linear Approx.
| | | | |
0 t1 t2 t3 t4 t (s) 1— P1— P (atm) Pmin— Pressure during the experiment
P0 = 101.3 kPa = 101300 Pa = 14.7 psi = 1013 mBar = 30 inHg = 760 mmHg = 32 ft of sea water = During a normal weather day, the ambient pressure will often vary by about 0.1 to 0.2 kPa per hour. This translates to an ambient pressure-induced drift of about 8 to 16 m per hour.
| | | | |
0 t1 t2 t3 t4 t (s) Hmax— H (ft) H0— SL— Altitude during the experiment
P = P0 * exp (-h/h0 ) P0 = 101.3 kPa h0 = 8435 m
(Std Atm 1976)
h = k1 * P + k0 k1 = -307 ft/kPa = -93.4 m/kPa k0 = 30,900 ft = 9410m
Varies with time and location. Higher intensity at greater latitudes Solar storms cause rapid (minutes to hours) changes (K-index)
At our lat long: Intensity ~500 mG, Dip ~ 60 deg, Declination = 15 deg E The included magnetometer measures 3 axes in milli Gauss with a resolution of 1 mG and a precision of .75 mG. Avoid interference: Common refrigerator magnets have intensities of ~ 100 G Iron anywhere nearby will also disrupt readings
http://endeavourinstitute.org/
http://championship.endeavours.org/ http://regional.endeavours.org/
http://scipp.ucsc.edu/outreach/balloon