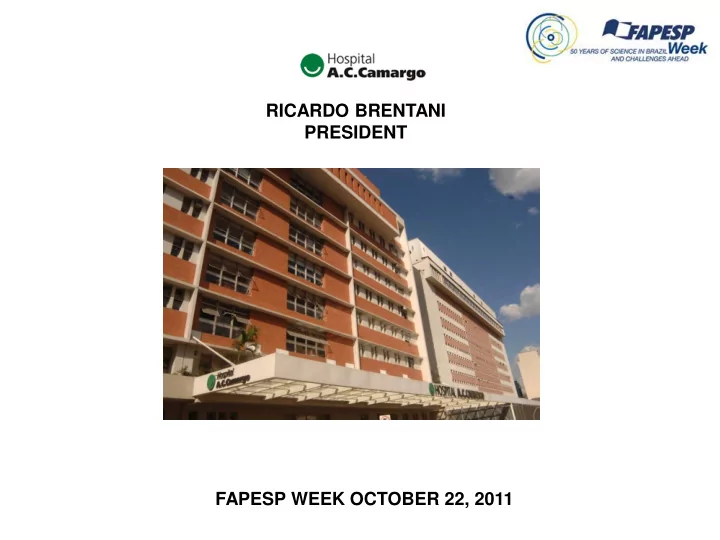

RICARDO BRENTANI PRESIDENT FAPESP WEEK OCTOBER 22, 2011
400.000 outpatient visits/year 16.000 new cancer cases/year 320 beds / 24 ICU beds 11.000 Surgeries/year 300.000 Hospital records (87-95% 5-year follow up) 1.500.000 Paraffin blocks 38,145 Paraffin blocks from 2543 autopsies 86% 5-years follow-up
Ranking da Produção Científica do Brasil nas 48 subáreas da medicina no quinquênio 2005-2009. (1º a 16º) Nº % Artigos Rank Área do conhecimento Artigos Citação Impacto no Mundo 1 Pharmacology & Pharmacy 4.203 17.048 4,06 2,86 2 Dentistry Oral Surg & Med 3.403 9888 2,91 10,41 3 Public Env & Occ Hlth 3.365 6680 1,99 4,07 4 Surgery 2.650 7113 2,68 1,99 5 Immunology 2.328 13.184 5,66 2,40 6 Tropical Med 2.147 4829 2,25 20,84 7 Endocrinology & Metabolism 1.828 8.029 4,39 2,67 8 Med Res & Experimental 1.572 5.568 3,54 2,88 9 Clinical Neurology 1.550 6.962 4,49 1,53 10 Infectious Diseases 1.456 8.483 5,83 3,30 11 Cardiac & Cardiovascular Sys 1.411 6.289 4,46 1,92 12 Physiology 1.163 4.037 3,47 2,30 13 Oncology 1.129 11.765 10,42 0,89 1.129 11.765 13 Oncology 10,42 0,89 14 Nutrition & Dietetics 1.127 3.487 3,09 3,16 15 Pediatrics 1.099 2.737 2,49 1,81 16 Med General & Internal 1.061 1910 1,80 1,42 Fonte: ISI - Institute for Scientific Information. CD-Rom: National Science Indicators - Base Deluxe – SCI 2009, USA.
8 PRODUÇÃO CIENTÍFICA Entre as 48 principais especialidades médicas, Oncologia é a de maior impacto em produção científica no Brasil (quinquênio 2005 – 2009). Fonte: ISI – Institute for Cientific Information, CD-Rom: National Science Indicators – Base de Luxe – SCI 2009, USA Produção Científica sobre Oncologia no Brasil (2005-2009) 39% Produção A.C. Camargo (668) 61% Outras Instituições (441) Total 1.129 Artigos 141 Artigos publicados em Revistas Internacionais até outubro de 2010.
Institutos - Sudeste 77 Institutos
Yoshimoto et al, Britsh Journal Cance, 97,678, 2007
Silvia Vanessa Lourenço, et.al, Histopathology 2010
Table 1. HCGP and CGAP transcript sequence generation and clustering ORESTES submitted to GenBank 823,121 sequences CGAP EST submitted to GenBank 1,214,358 sequences TOTAL EST submitted to GenBank 2,037,479 sequences Total clusters 32,129 clusters Total clusters with known genes 22,152 clusters Clusters without known genes 9,977 clusters Clusters without known genes but with coding potential 1,285 clusters Estimated total genes based on HCGP and CGAP data 23,437 genes Brentani H. et al, Proc Natl Acad Sci U S A; 100(23):13418-13423,2003
Array Production : With Bioinformatics, we can design “project - oriented” arrays, Exploitation of ORESTES clone collection. 4.8K: Only full length genes Filtered for repetitive sequences Single hit with human genome Less than 85% homology with any other stretch of 100bp within the human genome 3’ end most, but 5’ from the first polyA signal Not less than 300bp Sequence verified Link to external databases (NCBI, SOURCE, GO, etc) Brentani R.R et al – Critical Reviews in Oncology Hematology 54:95-105, 2005
Some clinically relevant questions we are currently pursuing:
• Can we improve diagnosis?
Isabella Werneck Cunha, et al; Translational Oncology (2010) 3, 23-32
• Can we improve prognosis?
The use of Fisher’s Discriminant Analysis to define predictive trios of genes for gastric cancer About the Cover The cover shows a molecular classifier for gastric cancer based on the expression levels of three genes in normal gastric mucosa (green frame) gastritis (blue frame), intestinal metaplasia (brown frame) and gastric adenocarcinoma (red frame). The authors describe the construction of molecular classifiers based on trios of genes that can discriminate between malignant and non- malignant samples. Importantly, some samples of intestinal metaplasia, known to be at higher risk of becoming malignant, showed signatures that resemble that of a tumor sample. For details, see the article by Meireles et al. on page 1255 of this issue.
Gene expression signature for DCIS progression 147 differentially expressed genes (DEG) Normal epithelial samples pureDCIS Statistical significant enrichment: In situ component • cell adhesion (represented by C20orf42 , DCIS/IDC LPXN, LKC, DGCR2 , AZGP1, CHST10, ITGB2 , 60% of Pure DCIS (3/5) were PLEKHC1, PCDH10 and NEDD9 ) grouped with normal epithelial samples and discriminated from • cellular defense (represented by CXCL9, DCIS/IDC MAPRE2 and C3AR1 ) Castro et al ., Breast Cancer Res. 2008
• Can we investigate etiology?
Unsupervised hierarchical clustering based on the expression patterns of the 18 genes recapitulated in WT Samples from differentiated and intermediate kidneys from humans and mice were grouped together and discriminated from the WT samples. WT samples were grouped with the pool of human fetal kidneys and the earliest mouse embryonic kidneys • Model for interspecific hybridization proved to be appropriate for studying human tumorigenesis and mouse embryogenesis • Gene expression signature linked with Wnt and related signaling pathways was associated with WT onset. • Maschietto et al., Cell, Death and Disease, in press
• Can we predict response to therapy?
Folgueira et al, Clin Cancer Res. 2005 Oct 15;11(20):7434-7443
Table 1. HCGP and CGAP transcript sequence generation and clustering ORESTES submitted to GenBank 823,121 sequences CGAP EST submitted to GenBank 1,214,358 sequences TOTAL EST submitted to GenBank 2,037,479 sequences Total clusters 32,129 clusters Total clusters with known genes 22,152 clusters Clusters without known genes 9,977 clusters Clusters without known genes but with coding potential 1,285 clusters Estimated total genes based on HCGP and CGAP data 23,437 genes Brentani H. et al, Proc Natl Acad Sci U S A; 100(23):13418-13423,2003
Mello, B.P., et al, Nucleic Acids Research, 2009
Amostras sem alteração cromossômica (CGH) Amostras com alteração cromossômica (CGH) Amostra sem CGH ncRNA _ Transritos intrôncicos e Genes codificadores de proteína intergênicos High Risk Low Risk
Análise de sobrevida – Alto e baixo risco baseados em expressão gênica 100 80 Recurence-Free (%) 60 40 High Risk Low Risk 20 p value = 6e-08 0 0 20 40 60 80 100 Time (months)
Carraro et al, PlosOne, 2011, 6 e 21022
Recommend
More recommend