PRESENTATION OF LONG-TERM MATRIC SUCTION MEASUREMENTS IN A HIGHWAY - - PDF document

presentation of long term matric suction measurements in
SMART_READER_LITE
LIVE PREVIEW

PRESENTATION OF LONG-TERM MATRIC SUCTION MEASUREMENTS IN A HIGHWAY - - PDF document

PRESENTATION OF LONG-TERM MATRIC SUCTION MEASUREMENTS IN A HIGHWAY SUBGRADE USING THERMAL CONDUCTIVITY SENSORS Q. Nguyen 1 , L. Samarasekera 1 , D.G. Fredlund 2 & B.L. Marjerison 3 1) University of Saskatchewan, Saskatoon, Canada 2) Golder


slide-1
SLIDE 1

·487·

PRESENTATION OF LONG-TERM MATRIC SUCTION MEASUREMENTS IN A HIGHWAY SUBGRADE USING THERMAL CONDUCTIVITY SENSORS

  • Q. Nguyen1, L. Samarasekera1, D.G. Fredlund2 & B.L. Marjerison3

1) University of Saskatchewan, Saskatoon, Canada 2) Golder Associates Ltd., Saskatoon, Canada 3) Saskatchewan Highways and Transportation, Saskatoon, Canada

Abstract: At each of two Thin Membrane Surface (TMS) highway locations in Saskatchewan, Canada, 16 thermal conductivity sensors had been installed to monitor in situ matric suctions. The matric suctions were calculated using the drying branch of the hysteresis loop that represents the calibration curve. The soil suction measurements showed a strong seasonal pattern. Suctions showed a correlation to rainfall. Relatively constant suctions were encountered under the driving-lane. Under the side-slope, the matric suctions were found to vary considerably with time and location. For the depths below 2.0 m, the differences in matric suctions under the driving-lane and under the side-slope were small.

  • 1. INTRODUCTION

Thin Membrane Surface (TMS) highways consist of compacted native soils forming the subgrade material covered with a thin layer of asphalt to provide a dust free driving surface. The strength of the highway subgrade depends not only

  • n total stresses but also on matric suction in the
  • soil. Matric suction can be measured using thermal

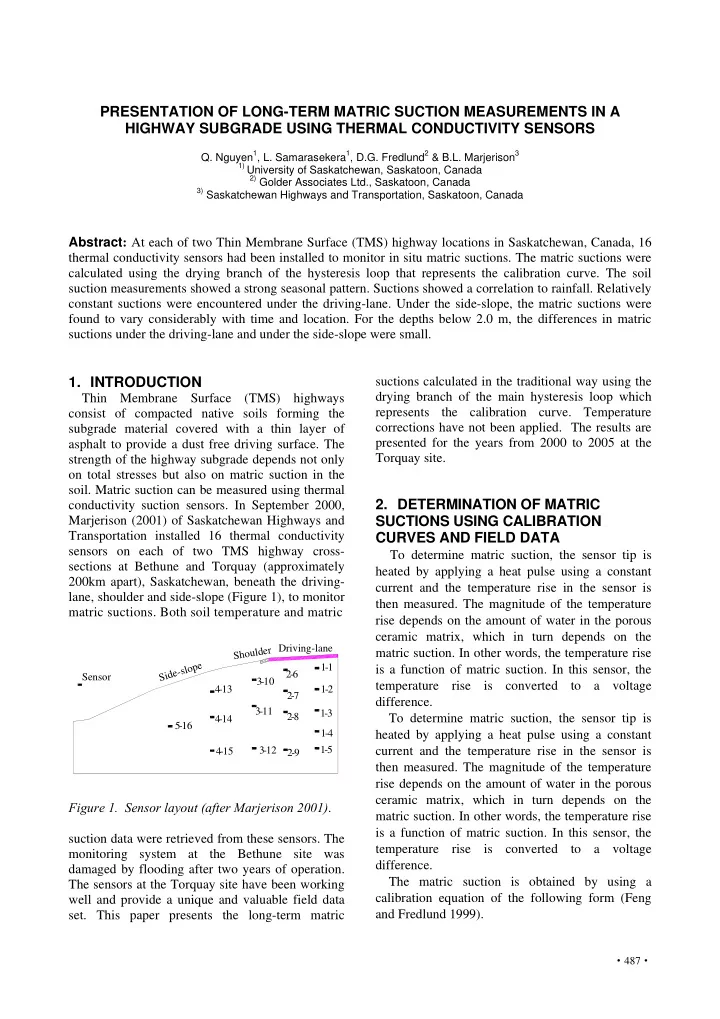
conductivity suction sensors. In September 2000, Marjerison (2001) of Saskatchewan Highways and Transportation installed 16 thermal conductivity sensors on each of two TMS highway cross- sections at Bethune and Torquay (approximately 200km apart), Saskatchewan, beneath the driving- lane, shoulder and side-slope (Figure 1), to monitor matric suctions. Both soil temperature and matric

Shoulder Side-slope Driving-lane 1-1 2-8 1-2 2-7 1-3 1-4 4-15 4-14 5-16 4-13 1-5 3-11 3-10 2-6 3-12 2-9 Sensor

Figure 1. Sensor layout (after Marjerison 2001). suction data were retrieved from these sensors. The monitoring system at the Bethune site was damaged by flooding after two years of operation. The sensors at the Torquay site have been working well and provide a unique and valuable field data

  • set. This paper presents the long-term matric

suctions calculated in the traditional way using the drying branch of the main hysteresis loop which represents the calibration curve. Temperature corrections have not been applied. The results are presented for the years from 2000 to 2005 at the Torquay site.

  • 2. DETERMINATION OF MATRIC

SUCTIONS USING CALIBRATION CURVES AND FIELD DATA

To determine matric suction, the sensor tip is heated by applying a heat pulse using a constant current and the temperature rise in the sensor is then measured. The magnitude of the temperature rise depends on the amount of water in the porous ceramic matrix, which in turn depends on the matric suction. In other words, the temperature rise is a function of matric suction. In this sensor, the temperature rise is converted to a voltage difference. To determine matric suction, the sensor tip is heated by applying a heat pulse using a constant current and the temperature rise in the sensor is then measured. The magnitude of the temperature rise depends on the amount of water in the porous ceramic matrix, which in turn depends on the matric suction. In other words, the temperature rise is a function of matric suction. In this sensor, the temperature rise is converted to a voltage difference. The matric suction is obtained by using a calibration equation of the following form (Feng and Fredlund 1999).

slide-2
SLIDE 2

·488·

( )

d

V c a V b ⎟ ⎠ ⎞ ⎜ ⎝ ⎛ Δ − − Δ = ψ

(1)

where: ψ = matric suction; ΔV = voltage difference prior to and after heating; a, b, c and d are fitting parameters from the laboratory calibration of the sensors. The relationship between the water content in the sensor ceramic and its matric suction is hysteretic (i.e., the water content at a given suction for the wetting path is smaller than that for the drying path). The matric suctions in sensors have traditionally been calculated using the main drying calibration curve which is obtained by subjecting the sensor to a sequence of applied suctions at 23oC in the laboratory. The sensors were operational from 0o C to 40o C at the sites (Note: no suctions can be measured when water inside the sensor freezes). The temperature rise measured by a sensor, when a heat pulse is applied, can be affected by the ambient

  • temperature. However, when obtaining matric

suctions from thermal conductivity sensors, traditionally as well as for this paper, for simplification and initial presentation purposes, no temperature corrections are made to the calculations of the matric suctions.

  • 3. MATRIC SUCTIONS ON VERTICAL

GRID-LINE UNDER THE DRIVING-LANE

Three sensors; T1-1, T1-2 and T1-5 were selected to show the matric suction variation along a vertical grid-line under the driving-lane. The in situ matric suctions obtained using the drying curve

  • f the main hysteresis loop of calibration from

these sensors for a period from 2000 to 2005 are plotted in Figure 2. A portion of the five-year average matric suctions of the three sensors are shown in Figure 3 (The sensors were not able to provide meaningful readings during freezing time). The matric suctions under the driving-lane varied from 25 to 100 kPa and demonstrated sharp changes following a seasonal pattern. The sensors closer to the ground surface provided suctions that fluctuated more compared to the deeper sensors. In addition, the shallower sensors had longer periods

  • f interrupted readings due to water freezing in the
  • sensors. Sensor T1-5 at bottom grid recorded

suctions throughout the entire monitoring period. The differences in matric suctions at a specific time calculated from year to year were less than 30 kPa. Figure 2. In situ matric suctions along vertical grid-line under the driving-lane from 2000-2005.

slide-3
SLIDE 3

·489·

Figure 3. Five-year average suctions along vertical grid-line under the driving-lane.

  • 4. MATRIC SUCTIONS ON VERTICAL

GRID-LINE UNDER THE SIDE-SLOPE

There are three sensors located in the vertical grid-line under the side-slope at the Torquay site. These are T4-13, T4-14, and T4-15 at 0.5 m, 1.1 m and 1.9 m depths respectively. The in situ matric suctions from these sensors for the period from 2001 to 2005 are shown in Figure 4. The five-year average matric suctions from these sensors are presented in Figure 5. The variations in matric suctions at Sensor T4- 13 were significantly greater than the deeper sensors on the same vertical grid-line. The maximum suction curve was about 10,000 kPa at Sensor T4-13 in November 2002 and 2003. As can be seen in Figure 4, the matric suctions at depth 1.9 m ranged from 50 kPa to 100 kPa. At depth 1.1 m, the matric suctions were 100 to 500 kPa; and 100 to roughly 10,000 kPa at depth 0.5

  • m. Thus, the variations in matric suction became

greater when closer to the ground surface. In general, the five-year average values reached maximum values in April and the lowest values were witnessed in June (Figure 5).

  • 5. MATRIC SUCTIONS ON HORIZONTAL

GRID-LINE ALONG TOP SENSOR

There are four sensors T1-1, T2-6, T3-10 and T4-13 along the top horizontal grid-line (i.e., near the ground surface). The in situ matric suctions from these sensors for the period from 2000 to 2005 are shown in Figure 6. The variations in matric suctions at Sensor T4-13 were significantly greater than for the other sensors on the same horizontal grid-line. The suctions varied more considerably with distance from the centerline of the highway. The matric suctions at distances between 1.0 to 2.5 m (i.e. under pavement) from the centerline ranged from 20 to 100 kPa. Under the side-slope, the average-monthly suctions varied from 100 to about 10,000 kPa. In Figure 7, the variation (the dashed area) of suctions under pavement increased with distance from the highway centerline.

slide-4
SLIDE 4

·490·

Figure 4. In situ matric suctions along vertical grid-line under the side-slope. Figure 5. Five-year average suctions along vertical grid-line under the side-slope.

slide-5
SLIDE 5

·491·

Figure 6. In situ matric suctions along top horizontal grid-line at depths of 0.3 – 0.5 m. Figure 7. Five-year average-monthly suctions along top sensors versus distance from the centerline of highway.

slide-6
SLIDE 6

·492·

Figure 8. Variations in suction with rainfall and time at sensor T4-13, 0.3 m deep under the side-slope.

  • 6. INTERPRETATION OF THE MATRIC

SUCTION PATTERNS WITH RESPECT TO PRECIPITATION

Matric suctions changed in response to rainfall

  • n the side-slope as illustrated in Figure 8. A

correspondence between the rainfall and the matric suctions was witnessed under the side-slope. In general, the lowest matric suctions and largest rainfall were recorded at the end of June. Matric suctions at Sensor T4-13 appeared to be the highest among the sensors installed in the highway subgrade with the values ranging from 100 kPa to 10,000 kPa. It is suggested that this observation in behavior might be due to the high evapotranspiration on the side-lope area.

  • 7. CONCLUSIONS

Soil suctions under a TMS highway showed a clear response to the rainfall at the test site. Since the ground-water tables were deep and stable, the water entered and exited the subgrade primarily through the unpaved surface along the side-slope. Suctions under the driving-lane were relatively stable (25-100 kPa). The matric suctions were found to vary considerably with time under the side-slope (100-10,000 kPa).

REFERENCES

Feng, M. and Fredlund, D.G. 1999. Hysteretic influence associated with thermal conductivity sensor measurements. In Proc. From Theory to the Practice of Unsaturated Soil Mechanics, 52nd Canadian Geotechnical Conference, Regina, SK, Canada, October 23-24: pp. 14:2:14-14:2:20. Marjerison, B. 2001. Measurement of matric suction in thin membrane surface highways using thermal conductivity sensors. M.Sc. thesis, University of Saskatchewan, Saskatoon, SK. Nguyen, Q. 2006. Long-term matric suction measurements in highway subgrades. M.Sc. thesis, University of Saskatchewan, Saskatoon, SK. Shuai, F., Clements, C., Ryland, L. and Fredlund, D.G. 2002. Some factors that influence soil suction measurement using a thermal conductivity sensor. Third International Conference on Unsaturated soils, UNSAT 2002, March 10-13, 2002, Recife, Brazil: pp. 325-329.