
SLIDE 1
DATA SCIENCE SUMMER SCHOOL @ UNI VIENNA TUTORIAL: TABLEAU 1
Prerequisites
- You have installed Tableau Desktop on your computer.
Available here: http://www.tableau.com/academic/students
- You have downloaded the data (athlete_events.csv)
available here: https://www.kaggle.com/heesoo37/120-years-of-olympic-history- athletes-and-results or here https://www.dropbox.com/s/6h5n8pcfwvc6wdl/athlete_events.csv?dl=0
Motivation
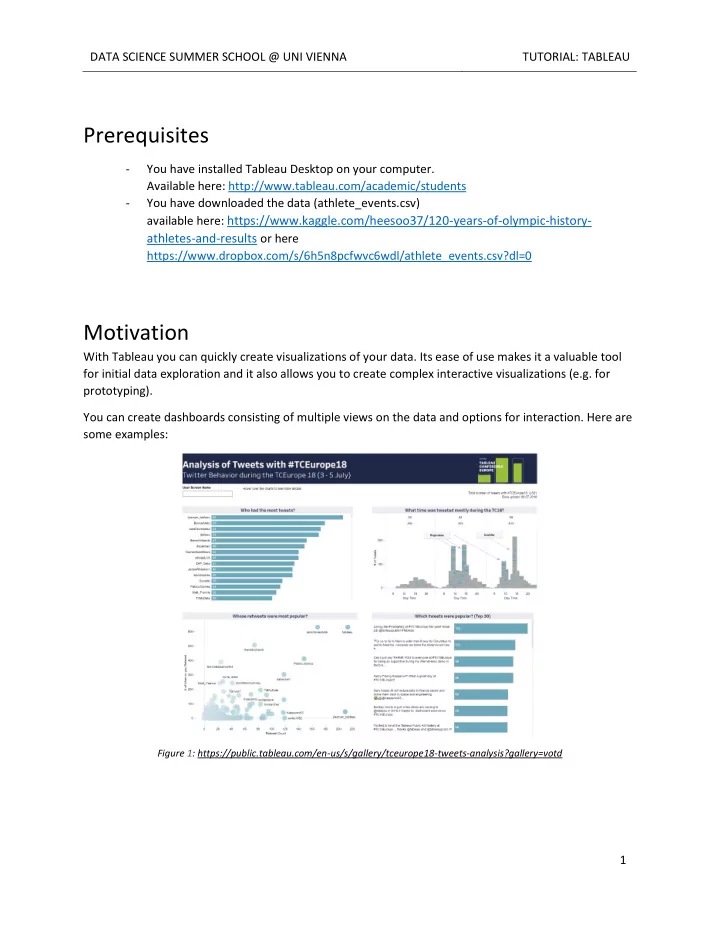
With Tableau you can quickly create visualizations of your data. Its ease of use makes it a valuable tool for initial data exploration and it also allows you to create complex interactive visualizations (e.g. for prototyping). You can create dashboards consisting of multiple views on the data and options for interaction. Here are some examples:
Figure 1: https://public.tableau.com/en-us/s/gallery/tceurope18-tweets-analysis?gallery=votd