SLIDE 8 Multi-Family
The North Cary/Morrisville multi-fam- ily submarket is consistently among the broader Raleigh market’s most active construction submarkets. Demand is driven, in part, by recently graduated young professionals arriving from nearby universities. Transplants moving to the area for new job oppor- tunities, however, also drive demand, making the submarket somewhat dynamic, as it is not as afgected by traditional, geographic market area constraints. The submarket has total current inventory of nearly 21,000 units, with absorption at a litule over 1,000 units
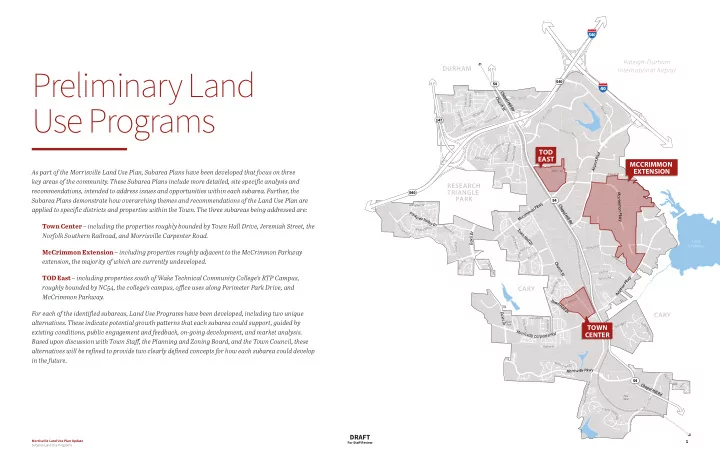
- ver the past 12 months. Factoring in
869 units currently under construc- tion and over 1,700 vacant units, there are currently approximately 31 months
- f existing and projected inventory
- available. Multi-family demand in the
submarket, however, is projected to continue to grow by approximately 1,300 units, given the Raleigh area’s projected population growth over the next fjve years. It is not unreasonable to assume that multi-family units proposed in the subarea plans could capture a signifjcant portion of this
- demand. It should be noted, however,
that denser subarea alternatives, specifjcally McCrimmon Extension Alternative #2 and Town Center Alter- native #2, would most likely require buildout periods of fjve to 10 years.
Ofgice
The RTP/RDU offjce submarket is relatively strong, with only 11 months
- f existing inventory and planned
deliveries currently available. The current 2.2 percent vacancy rate also underscores the health of the local
- ffjce market. Recent deliveries in the
RTP/RDU submarket include Perime- ter Park Five and Perimeter Park Six. Perimeter Park Six includes roughly 200,000 square feet, and Relias Health pre-leased more than half of the build- ing prior to delivery. Perimeter Park Five is fully leased by a single user and includes more than 250,000 square feet of space. Offjce space has been proposed for at least one alternative for each of the three subareas. Given strong market conditions and the desirable locations
- f the McCrimmon Parkway and TOD
East subareas, new offjce space in these areas should absorb relatively quickly into the marketplace. The viability
- f offjce space included in the Town
Center subarea is less certain, however, as product located in mixed-use developments represents such a small portion of existing inventory. None- theless, the less dense development proposed in Alternative #1 could easily absorb into the market at buildout; the market viability for offjce proposed in Alternative #2 is less certain.
Retail
The local retail submarket is also strong, with only 10 months of exist- ing inventory and planned deliveries currently available. Retail space has been proposed for each of the three
- subareas. With annual absorption of
approximately 375,000 square feet and continued population and employ- ment growth, the proposed retail space in nearly all the subarea alternatives appears to have the necessary market support to make the developments
- feasible. The exception, however,
would be the denser Alternative #2 for the Town Center subarea. Given the subareas limited visibility, a signifj- cant proportion of the subareas retail space would need to be supported from within the subarea. As such, the success of this denser alternative would depend, in large part, to the success of the multi-family develop- ment included in this alternative.
Industrial & Flex
The RTP/RDU submarket is home to more than 8.7 million square feet of industrial and fmex space housed in 172
- buildings. Net absorption, however,
has recently not kept pace with new deliveries, indicated by negative absorption of approximately 130,000 square feet over the past 12 months. But over the past fjve years, absorption has averaged approximately 89,000 square feet. Industrial and fmex uses have only been proposed for alterna- tives in the McCrimmon Extension subarea.
Population and Housing, 2010-24
Town of Morrisville
2010 2019 2024 CAGR* 10-19 CAGR* 19-24 Population 18,576 29,170 33,946 5.1% 3.1% Total Housing Units 8,357 12,127 13,743 4.2% 2.8% Owner-Occupied 3,698 6,782 8,071 7.0% 3.5% Renter-Occupied Units 3,943 4,177 4,304 0.6% 0.6% Vacant Units 716 1,168 1,368 5.6% 3.2%
*Compound Annual Growth Rate Source: ESRI Business Analyst, U.S. Census Bureau
Multi-Family Inventory, 2019
North Cary/Morrisville Submarket
Current 5-year avg. Vacant Units 1,769 1,405 Vacancy Rate 8.8% 7.6% 12 Mo. Absorption Units 1,024 537 Existing Units 20,984 18,561 12 Mo. Const. Starts 700 663 Under Construction 869 897 12 Mo. Deliveries 1,174 666 Absorption time (mos.) 31 51
Sources: Esri Business Analyst, U.S. Census Bureau, CoStar, and Houseal Lavigne
Multi-Family Demand, 2019-22
North Cary/Morrisville Submarket
Population forecast (2022) 125,000
2.50 Household forecast 50,000
46.9% Potential demand (units) 23,446 Plus: Frictional vacancy 5.0% Total supportable demand 22,273 Less: Existing inventory (20,984) Potential demand (units) 1,289
Sources: Esri Business Analyst, U.S. Census Bureau, CoStar, and Houseal Lavigne
Ofgice Inventory and Demand, Current
RTP/RDU Submarket
Current 5-year avg. 12-mo. absorption (sf) 546,491 330,458 12-mo. leasing (sf) 619,436 927,851 Existing buildings 109 103 Existing sf 9,417,033 8,601,725 12-mo. constr. starts (sf) 206,382 225,384 Under construction (sf) 310,900 304,623 12-mo. deliveries (sf) 567,932 233,208 Vacancy (pct.) 2.2% 11.5% Vacant space (sf) 207,175 989,198 Absorption time (mos.) 11 47
Sources: CoStar, Houseal Lavigne
Retail Inventory and Demand, Current
RTP/RDU Submarket
Current 5-year avg. 12-mo. absorption (sf) 375,244 193,380 12-mo. leasing (sf) 69,590 60,281 Existing buildings 182 161 Existing sf 2,914,615 2,626,070 12-mo. constr. starts (sf) 165,239 105,528 Under construction (sf) 155,630 135,112 12-mo. deliveries (sf) 126,873 147,851 Vacancy (pct.) 5.0% 6.0% Vacant space (sf) 145,731 157,564 Absorption time (mos.) 10 18
Sources: CoStar, Houseal Lavigne
Ind./Flex Inventory and Demand, Current
RTP/RDU Submarket
Current 5-year avg. 12-mo. absorption (sf) (130,076) 89,113 12-mo. leasing (sf) 1,062,946 755,044 Existing buildings 172 171 Existing sf 8,714,781 8,645,358 12-mo. constr. starts (sf)
Under construction (sf)
12-mo. deliveries (sf) 70,481 66,292 Vacancy (pct.) 6.2% 4.4% Vacant space (sf) 540,316 380,396 Absorption time (mos.) (50) 55
Sources: CoStar, Houseal Lavigne
Market Assessment
DRAFT
For Stafg Review
8
Morrisville Land Use Plan Update Subarea Land Use Programs