
SLIDE 1
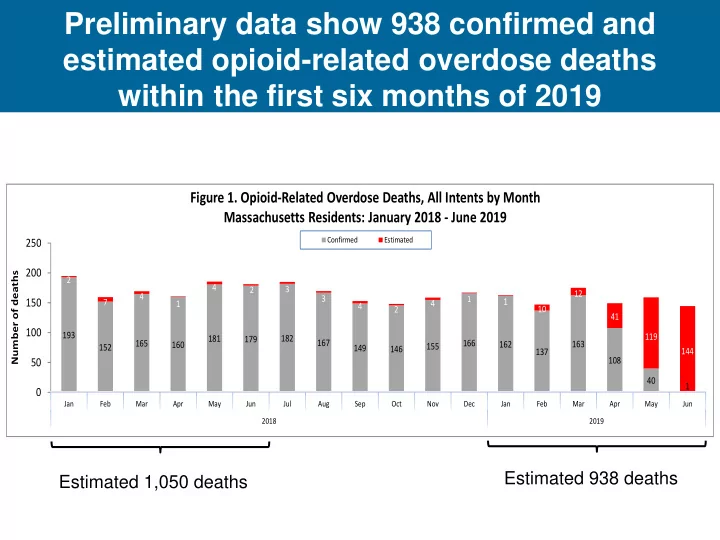
Preliminary data show 938 confirmed and estimated opioid-related overdose deaths within the first six months of 2019
193 152 165 160 181 179 182 167 149 146 155 166 162 137 163 108 40 1 2 7 4 1 4 2 3 3 4 2 4 1 1 10 12 41 119 144
50 100 150 200 250
Jan Feb Mar Apr May Jun Jul Aug Sep Oct Nov Dec Jan Feb Mar Apr May Jun 2018 2019
Number of deaths
Figure 1. Opioid-Related Overdose Deaths, All Intents by Month Massachusetts Residents: January 2018 - June 2019
Confirmed Estimated