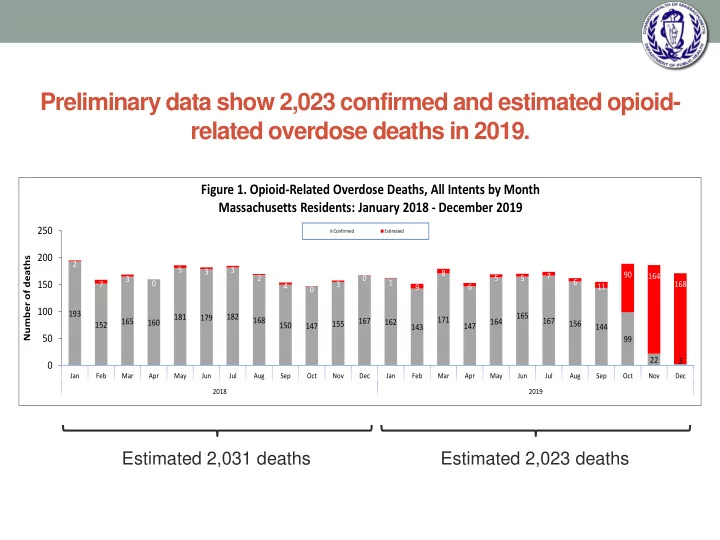

Preliminary data show 2,023 confirmed and estimated opioid- related overdose deaths in 2019. Figure 1. Opioid-Related Overdose Deaths, All Intents by Month Massachusetts Residents: January 2018 - December 2019 250 Confirmed Estimated 200 Number of deaths 2 5 3 3 8 90 7 164 5 2 0 5 3 1 6 150 0 7 3 168 4 6 11 9 0 100 193 165 181 182 179 171 168 167 167 165 164 160 162 155 156 152 150 147 147 144 143 50 99 22 3 0 Jan Feb Mar Apr May Jun Jul Aug Sep Oct Nov Dec Jan Feb Mar Apr May Jun Jul Aug Sep Oct Nov Dec 2018 2019 Estimated 2,031 deaths Estimated 2,023 deaths
The rate of opioid-related overdose deaths has stabilized in 2019 compared with 2018 and has decreased an estimated 5% since 2016. Figure 3. Rate of Confirmed and Estimated Opioid-Related Overdose Deaths, All Intents Massachusetts Residents: 2000 - 2019 35 30.5 29.7 29.1 29.0 20% 30 -3% 25.4 -2% 0% per 100,000 Residents 25 28% 20 40% Rate 19.9 14.2 15 9.9 9.6 9.9 8.8 9.6 10 7.9 11.0 10.2 9.6 8.0 8.2 7.9 5 5.9 0 2000 2001 2002 2003 2004 2005 2006 2007 2008 2009 2010 2011 2012 2013 2014 2015 2016 2017 2018 2019
Fentanyl remains a key factor in opioid-related overdose deaths (93% present in toxicology screen). Figure 4. Percent of Opioid-Related Overdose Deaths with Specific Drugs Present Massachusetts Residents: 2014 - Q3 2019 Methodology 100 Change* 90 80 Fentanyl¹ 70 Likely Heroin 60 Percent Prescription Opioid² 50 Benzodiazepine 40 Cocaine 30 Amphetamine 3 20 10 0 1 2 3 4 1 2 3 4 1 2 3 4 1 2 3 4 1 2 3 4 1 2 3 2014 2015 2016 2017 2018 2019 Year and Quarter
The trajectory of the opioid epidemic would be far worse without public health interventions to address the crisis. Figure 6. Confirmed and Estimated Opioid-Related Overdose Deaths by Six Month Intervals, Massachusetts Residents: January 2012 - December 2019 3000 June 2015: Governor Baker's opioid 2500 working group delivers recommendations to combat the epidemic 2000 Count 1500 1000 500 0 Jan-Jun Jul-Dec Jan-Jun Jul-Dec Jan-Jun Jul-Dec Jan-Jun Jul-Dec Jan-Jun Jul-Dec Jan-Jun Jul-Dec Jan-Jun Jul-Dec Jan-Jun Jul-Dec 2012 2013 2014 2015 2016 2017 2018 2019 Actual Count Expected Count if Pre-2016 Rate of Change Continued
Prescription Monitoring Program – Data Trends Figure 1. Schedule II Opioid Prescriptions and MassPAT 1 Search Activity 2 Trends MA: Q1-2015 - Q4 2019 3,000,000 900,000 850,000 2,500,000 800,000 Number of Prescriptions Number of Searches 2,000,000 750,000 700,000 1,500,000 650,000 1,000,000 600,000 Mass PAT GoLive 550,000 Aug 22, 2016 500,000 Dec 7, 2015 3 Mar 15, 2016 4 Oct 15, 2016 5 500,000 0 450,000 1 2 3 4 1 2 3 4 1 2 3 4 1 2 3 4 1 2 3 4 2015 2016 2017 2018 2019 Total Schedule II Opioid Prescriptions Number of Searches by Prescribers and Pharmacists 1 MassPAT is the Massachusetts Prescription Awareness Tool (Online PMP) 2 Search activity includes prescribers, delegates, and pharmacists registered in MassPAT and licensed users of EHR Integration 3 Pharmacies required to report daily 4 STEP bill signed into law (7-day supply requirements go into effect) 5 MA prescribers required to look up patient when prescribing a Schedule II or III opioid medication • Registered MassPAT providers conducted more than 2.8 million searches in the 4 th quarter of 2019, an increase of approximately 500,000 searches since the previous quarter. • There were just under 500,000 Schedule II opioid prescriptions reported to the MA PMP in the 4 th quarter of 2019; this is a small decrease from the previous quarter and just over a 40% decrease from the 1st Quarter of 2015. • In the 4 th quarter of 2019, just over 225,000 individuals in Massachusetts received prescriptions for Schedule II opioids; this is a small decrease from the previous quarter and nearly a 42% decrease from the 1 st quarter of 2015.
Recommend
More recommend