Preliminary CFD Analysis for a Natural Circulation Flow between a - - PDF document

preliminary cfd analysis for a natural circulation flow
SMART_READER_LITE
LIVE PREVIEW

Preliminary CFD Analysis for a Natural Circulation Flow between a - - PDF document

Transactions of the Korean Nuclear Society Virtual Spring Meeting July 9-10, 2020 Preliminary CFD Analysis for a Natural Circulation Flow between a Reactor and Steam Generator in an OPR100 Hyung Seok Kang , Sung Il Kim, Eun Hyun Ryu, and


slide-1
SLIDE 1

Preliminary CFD Analysis for a Natural Circulation Flow between a Reactor and Steam Generator in an OPR100

Hyung Seok Kang, Sung Il Kim, Eun Hyun Ryu, and Kwang Soon Ha Korea Atomic Energy Research Institute, 989-111, Daedeok-daero, Yuseong, Daejeon, 305-353, Republic of Korea

*Corresponding author: hskang3@kaeri.re.kr

  • 1. Introduction

KAERI is now performing a MELCOR analysis for the a temperature induced steam generator tube rupture accident (TI-SGTR) initiated by a station blackout in an

  • ptimized power reactor 1000 MWe (OPR1000) because

the TI-SGTR is one of the most important accident scenarios and needs to be considered to confirm that an

  • perating nuclear power plant meets regulations related
  • n the severe accident [1]. To perform a 1-dimensional

MELCOR analysis, some input parameters considering a 3-dimensional phenomenon, such as the mixing fraction, recirculation ratio, hot tube fraction in the SG inlet plenum and the discharge coefficient in the hot leg, are needed to simulate the natural circulation flow of a hot gas from the damaged reactor core to the steam generator in the OPR1000. Thus we have performed a 3- dimensional analysis for the natural circulation flow between the hot leg and the SG during a severe accident in the OPR1000 using a commercial code ANSYS CFX 19.1 with an established analysis methodology [2,3]. The established methodology was obtained through a CFD analysis for a natural circulation between a reactor and a SG in the Westinghouse 1/7 scaled-down test facility [3,4]. In addition, we quoted the method of modeling the boundary conditions applied in a CFD analysis for a Westinghouse type plant [5].

  • 2. Development of a 3-Dimensional SG Model

2.1 Grid Model and Boundary Conditions A 3-dimensional SG model was developed and validated on the basis of the OPR1000 design data [6]. The number of tubes in the SG model was reduced by a ratio of 1/8 and its diameter was increased 3 times compared to the SG design data of OPR1000. Thus, the pressure drop and heat transfer occurred when a coolant flows though the tubes in the SG model during a normal

  • peration was simulated by a pressure loss coefficient

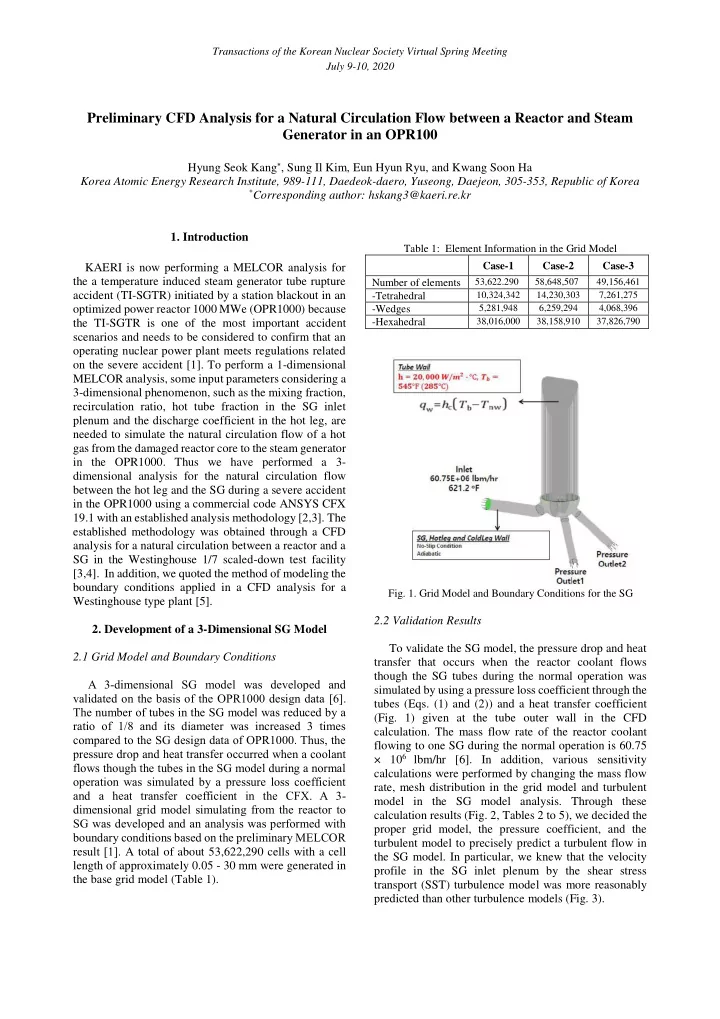
and a heat transfer coefficient in the CFX. A 3- dimensional grid model simulating from the reactor to SG was developed and an analysis was performed with boundary conditions based on the preliminary MELCOR result [1]. A total of about 53,622,290 cells with a cell length of approximately 0.05 - 30 mm were generated in the base grid model (Table 1).

Table 1: Element Information in the Grid Model Case-1 Case-2 Case-3 Number of elements

53,622.290 58,648,507 49,156,461

  • Tetrahedral

10,324,342 14,230,303 7,261,275

  • Wedges

5,281,948 6,259,294 4,068,396

  • Hexahedral

38,016,000 38,158,910 37,826,790

  • Fig. 1. Grid Model and Boundary Conditions for the SG

2.2 Validation Results To validate the SG model, the pressure drop and heat transfer that occurs when the reactor coolant flows though the SG tubes during the normal operation was simulated by using a pressure loss coefficient through the tubes (Eqs. (1) and (2)) and a heat transfer coefficient (Fig. 1) given at the tube outer wall in the CFD

  • calculation. The mass flow rate of the reactor coolant

flowing to one SG during the normal operation is 60.75 × 10⁶ lbm/hr [6]. In addition, various sensitivity calculations were performed by changing the mass flow rate, mesh distribution in the grid model and turbulent model in the SG model analysis. Through these calculation results (Fig. 2, Tables 2 to 5), we decided the proper grid model, the pressure coefficient, and the turbulent model to precisely predict a turbulent flow in the SG model. In particular, we knew that the velocity profile in the SG inlet plenum by the shear stress transport (SST) turbulence model was more reasonably predicted than other turbulence models (Fig. 3).

Transactions of the Korean Nuclear Society Virtual Spring Meeting July 9-10, 2020

slide-2
SLIDE 2
  • Fig. 2. Pressure Distribution by CFD using Standard k-ε

Turbulent Model Table 2: Comparison of Pressure Drop and Heat Transfer at Normal Operation between Design Datum and CFD Results (Grid Model Case-1, Standard k-ε Model, Normal Operation) CFD Design Data SG total △P [psi] 31.56 31.94 △P ① (Inlet Plenum) 3.28 3.35 △P ② (SG Tube) 27.16 27.78 △P ③ (Outlet Plenum) 1.12 0.81 Cold Leg Temp. [oF]

*Hot Leg Temp. : 621.2 oF

564.8 564.5 Table 3: Comparison of Pressure Drop and Heat Transfer between SG Design Data and CFD Results (Grid Model Case-1, Standard k-ε Model) **100% : Normal operation condition Table 4: Comparison of Pressure Drop and Heat Transfer between Design Datum and CFD Results (Grid Model Case-1, Normal Operation Condition) SST k-ε RSM SG total △P [psi] 30.01 30.97 30.66 △P ① (Inlet Plenum) 1.65 2.34 5.51 △P ② (SG Tube) 27.54 27.72 28.41 △P ③ (Outlet Plenum) 0.82 0.91 0.74 Cold Leg Temp. [oF]

*Hot Leg Temp. : 621.2 oF

564.3 564.4 564.8 Table 5: Comparison of Pressure Drop and Heat Transfer between Design Datum and CFD Results (SST Turbulent Model, Normal Operation Condition) Case-1 Case-2 Case-3 SG total △P [psi] 30.01 29.94 29.36 △P ① (Inlet Plenum) 1.65 1.40 1.36 △P ② (SG Tube) 27.54 27.75 27.24 △P ③ (Outlet Plenum) 0.82 0.79 0.76 Cold Leg Temp. [oF]

*Hot Leg Temp. : 621.2 oF

564.3 564.3 564.3

  • Fig. 3. Velocity Contours in the SG Inlet Plenum according to

Turbulent Models

  • 3. CFD Analysis

3.1 Grid Model and Flow Field Models A 3-dimensional grid model simulating from the reactor to the SG in the OPR1000 was developed based

  • n the validated SG model (Fig. 4) to analyze the natural

circulation flow of the mixture gas of steam-H2 in the hot leg and the SG inlet plenum. The end of the cold leg nozzle of the SG was blocked to simulate loop-seal phenomenon during the severe accident. A total of about 63,065,389 cells with tetrahedral, pyramids, wedge, and hexahedra elements were generated in the grid model.

  • Fig. 4. Grid Model for Natural Circulation Flow in the Hot

Leg and SG Inlet Plenum of OPR1000 90% 100% 110% SG total △P [psi] 26.35 31.56 40.51 △P ① (Inlet Plenum) 2.67 3.28 4.80 △P ② (SG Tube) 22.90 27.16 34.02 △P ③ (Outlet Plenum) 0.78 1.12 1.69 Cold Leg Temp. [oF]

*Hot Leg Temp. : 621.2 oF

563.2 564.8 564.3 Transactions of the Korean Nuclear Society Virtual Spring Meeting July 9-10, 2020

slide-3
SLIDE 3

Transactions of the Korean Nuclear Society Virtual Spring Meeting July 9-10, 2020

The boundary conditions used for this natural circulation flow are shown in Table 6. These were

  • btained from the preliminary MELCOR analysis results

for the TI-SGTR of OPR1000 [1]. The decay heat generation in the core was not simulated because the purpose of this calculation was only to calculate 3- dimensional flow mixing between the hot gas and the cold gas in the hot leg and SG inlet plenum. To simulate the mixture gas flowing to the pressurizer from the hot leg, the outlet condition was given at the upper region of the surge line. The inlet condition was set at the core inlet to induce the stabilized flow field of the mixture gas in the upper plenum of the reactor vessel [5]. The natural circulation flow field was solved by applying the mass conservation, the momentum conservation with a full buoyancy model, energy conservation implemented in the ANSYS CFX 19.1 [7]. A turbulent flow was modeled by the SST model with the scalable wall function.

Table 6: Boundary Conditions for Natural Circulation Flow Inlet

Steam-H2 gas : 13.24 kg/s, 929.18 oC

Outlet

Zero reference pressure

Wall at SG Tubes

Heat transfer coeff. : 20.37 W/m2 oC’ Ambient temp. : 613.75 oC

3.2 Discussion on the CFD Results A steady state calculation was performed to obtain the converged solutions through approximately 3000

  • iterations. We assumed that the convergence criteria

were satisfied when the normalized residuals of the pressure, velocity, turbulence, and enthalpy reached approximately 1.0 × 10⁻⁴. The calculation results of the velocity profile and temperature distribution are shown in Fig. 5. Through the CFD results, we can know that the natural circulation flow pattern in the hot leg and SG inlet plenum is accurately simulated to produce the MELCOR input parameters. Finally, we proposed a mixing fraction

  • f 0.84, recirculation ratio of 1.44, hot tube fraction of

0.424, and discharge coefficient of 0.16 for the MELCOR analysis through this CFD analysis (Table 7). These are located in the range between parameters of WH SG and Combustion Engineering (CE) SG (Table 8).

Table 7: MELCOR Input Parameters from CFD Results Parameter Value Recirculation ratio (r) r = mt / mh 1.44 Mixing fraction (f) f = 1-r(Tht-Tm)/(Th-Tm) 0.84 Hot tube fraction (a) *based on the areas of hot tube & cold tube 25.7% Discharge coefficient (Cd) Q = Cd (g×D5×△ρ/ρ )1/2 0.16 Th : gas temp. flowing to SG inlet plenum 744.8 oC Tht : gas temp. flowing to upper region of SG tubes 684.2 oC Tct : gas temp. returned from SG tubes 629.1 oC Tm : avg. temp. of the mixing zone 676.5 oC mh : gas flow rate to SG inlet plenum 7.89 kg/s mt : gas flow rate to upper region of SG tubes 11.42 kg/s

  • Fig. 5. CFD Results of Natural Circulation Flow in the Hot

Leg and SG Inlet Plenum of the OPR1000

slide-4
SLIDE 4

Table 8: Comparison of MELCOR Input Parameters between WH SG, CE SG, and OPR1000 SG Parameter

WH SG CE SG OPR1000 SG

Recirculation ratio (r)

2.4 1.05 1.44

Mixing fraction (f)

0.96 0.65 0.84

Hot tube fraction (a)

41% 22% 25.7%

Discharge coeff. (Cd)

0.12 0.13-0.14 0.16

  • 4. Conclusions and Further Work

KAERI performed a 3-dimensional analysis for a natural circulation flow in the hot leg and SG inlet plenum during a severe accident in an OPR1000 using a commercial code, ANSYS CFX 19.1, to determine the MELCOR input parameters. A 3-dimensional SG model was developed and validated on the basis of the OPR1000 design data. The MELCOR input parameters needed for the TI-SGTR analysis were presented on the basis of the preliminary CFD results. As a further work, we will have to recalculate the CFD analysis if new MELCOR results for the severe accident in the OPR1000 are produced. ACKNOWLEDGMENTS This work was supported by the National Research Foundation of Korea (NRF) grant funded by the Korea government (Ministry of Science, ICT, and Future Planning) (No. 2017M2A8A4015280) REFERENCES [1] S. I. Kim, Evaluation of Steam Generator Tube Rupture Accident Sequence Analysis, KAERI/TR- 7852/2019, Technical Report, KAERI, 2019. [2] H. S. Kang, S. I. Kim, and E. H. Ryu, Preliminary CFD Analysis for a natural circulation flow between a reactor and steam generator in an OPR1000, KAERI/TR- 7975/2019, Technical Report, KAERI, 2019. [3] H. S. Kang, S. I. Kim, E. H. Ryu, and K. S. Ha, “CFD Analysis for a Westinghouse Natural Circulation Experiment during Severe Accidents”, KNS Spring Meeting, Jeju, July 9-10, 2020. [4] C. F. Boyd and K. Hardesty, CFD Analysis of 1/7th Scale Steam Generator Inlet Plenum Mixing During a PWR Severe Accident, NUREG-1781, Technical Report, U.S.NRC, 2003. [5] C. F. Boyd and K. W. Armstrong, Computational Fluid Dynamics Analysis of Natural Circulation Flows in a Pressurized-Water Reactor Loop under Severe Accident Conditions, NUREG-1922, Technical Report, U.S.NRC, 2010. [6] G. C. Lee, Fluid System Engineering Design Data for Plant Safety Performance and Containment Analysis of YGN 3&4, 10487-FS-DD012, Rev.05, KAERI, 1994. [7] Ansys Inc., ANSYS CFX-19 Manual, 2018.

Transactions of the Korean Nuclear Society Virtual Spring Meeting July 9-10, 2020