CFD Analysis for a Westinghouse Natural Circulation Experiment during - - PDF document

cfd analysis for a westinghouse natural circulation
SMART_READER_LITE
LIVE PREVIEW

CFD Analysis for a Westinghouse Natural Circulation Experiment during - - PDF document

Transactions of the Korean Nuclear Society Virtual Spring Meeting July 9-10, 2020 CFD Analysis for a Westinghouse Natural Circulation Experiment during Severe Accidents Hyung Seok Kang , Sung Il Kim, Eun Hyun Ryu, and Kwang Soon Ha Korea


slide-1
SLIDE 1

CFD Analysis for a Westinghouse Natural Circulation Experiment during Severe Accidents

Hyung Seok Kang, Sung Il Kim, Eun Hyun Ryu, and Kwang Soon Ha Korea Atomic Energy Research Institute, 989-111, Daedeok-daero, Yuseong, Daejeon, 305-353, Republic of Korea

*Corresponding author: hskang3@kaeri.re.kr

  • 1. Introduction

A steam generator tube rupture (SGTR) accident is

  • ne of the most important accident scenarios and needs

to be considered to confirm that an operating nuclear power plant meets regulations related on the severe accident in Republic of Korea. A temperature induced steam generator tube rupture accident (TI-SGTR) is potentially a risk significant event because thermally induced SG tube failures caused by a hot gas from a damaged reactor core can induce a containment bypass event and a large release of fission products to the

  • environment. Therefore, KAERI is now performing an

experimental research study and a MELCOR analysis for the TI-SGTR accident initiated by a station blackout in an optimized power reactor 1000 MWe (OPR1000) [1]. Input parameters, namely, the mixing fraction, recirculation ratio, hot tube fraction in the SG inlet plenum and discharge coefficient in the hot leg, are necessary for simulating a natural circulation flow between a reactor and SG in the MELCOR analysis. Thus we are preparing a 3-dimensional analysis was conducted using a commercial code, ANSYS CFX 19.1, to produce the MELCOR input parameters for the OPR1000 [2]. To accurately analyze the 3-dimensional analysis for the OPR1000, we need to establish the analysis methodology through the comparison results between an experimental data and CFD result.

  • 2. Experimental Research

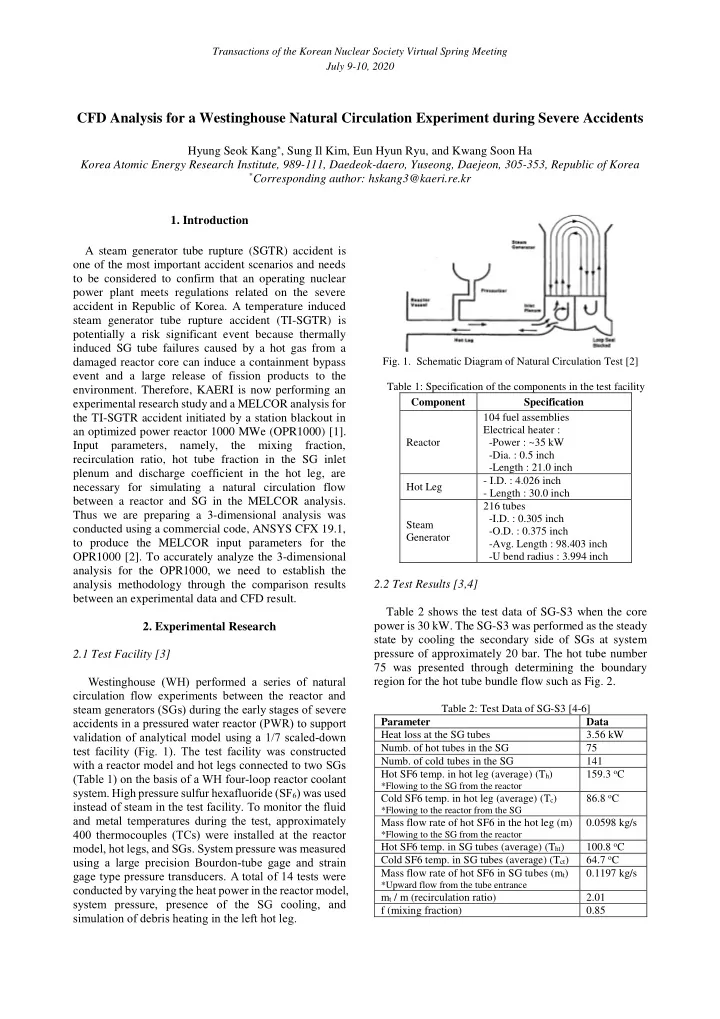
2.1 Test Facility [3] Westinghouse (WH) performed a series of natural circulation flow experiments between the reactor and steam generators (SGs) during the early stages of severe accidents in a pressured water reactor (PWR) to support validation of analytical model using a 1/7 scaled-down test facility (Fig. 1). The test facility was constructed with a reactor model and hot legs connected to two SGs (Table 1) on the basis of a WH four-loop reactor coolant

  • system. High pressure sulfur hexafluoride (SF6) was used

instead of steam in the test facility. To monitor the fluid and metal temperatures during the test, approximately 400 thermocouples (TCs) were installed at the reactor model, hot legs, and SGs. System pressure was measured using a large precision Bourdon-tube gage and strain gage type pressure transducers. A total of 14 tests were conducted by varying the heat power in the reactor model, system pressure, presence of the SG cooling, and simulation of debris heating in the left hot leg.

  • Fig. 1. Schematic Diagram of Natural Circulation Test [2]

Table 1: Specification of the components in the test facility Component Specification Reactor 104 fuel assemblies Electrical heater :

  • Power : ~35 kW
  • Dia. : 0.5 inch
  • Length : 21.0 inch

Hot Leg

  • I.D. : 4.026 inch
  • Length : 30.0 inch

Steam Generator 216 tubes

  • I.D. : 0.305 inch
  • O.D. : 0.375 inch
  • Avg. Length : 98.403 inch
  • U bend radius : 3.994 inch

2.2 Test Results [3,4] Table 2 shows the test data of SG-S3 when the core power is 30 kW. The SG-S3 was performed as the steady state by cooling the secondary side of SGs at system pressure of approximately 20 bar. The hot tube number 75 was presented through determining the boundary region for the hot tube bundle flow such as Fig. 2.

Table 2: Test Data of SG-S3 [4-6] Parameter Data Heat loss at the SG tubes 3.56 kW

  • Numb. of hot tubes in the SG

75

  • Numb. of cold tubes in the SG

141 Hot SF6 temp. in hot leg (average) (Th)

*Flowing to the SG from the reactor

159.3 oC Cold SF6 temp. in hot leg (average) (Tc)

*Flowing to the reactor from the SG

86.8 oC Mass flow rate of hot SF6 in the hot leg (m)

*Flowing to the SG from the reactor

0.0598 kg/s Hot SF6 temp. in SG tubes (average) (Tht) 100.8 oC Cold SF6 temp. in SG tubes (average) (Tct) 64.7 oC Mass flow rate of hot SF6 in SG tubes (mt)

*Upward flow from the tube entrance

0.1197 kg/s mt / m (recirculation ratio) 2.01 f (mixing fraction) 0.85 Transactions of the Korean Nuclear Society Virtual Spring Meeting July 9-10, 2020

slide-2
SLIDE 2

t kb i i

P g x

      

  • : Tube center location at 1 inch from tubesheet bottom

▲: Tube center location at 5 inch from tubesheet bottom

  • Temp. unit : oC
  • Fig. 2. Test SG-S3 Temp. of SF6 in the SG Tubes and

Boundary Region for Hot Tube Bundle Flow (dotted line) [3]

  • 3. CFD Analysis

3.1 Grid Model and Flow Field Models A 3-dimensional grid model simulating from the hot leg to the steam generator in the WH 1/7 test facility was developed under assumption of the symmetric flow behavior at the reactor between two steam generators (Fig. 3). The reactor model was not included in the grid model because it had very complicated geometry of the fuel assemblies with electrical heaters [3-5]. Instead of modeling the reactor model, we decided to simulate the natural circulation flow from the reactor to the SG through a boundary condition at the hot leg entrance on the basis of other research (Fig. 4) [4,6]. The inlet condition was given to 60% upper region of the hot leg entrance with the mass flow rate 0.046 kg/s and temperature 448 K. The outlet condition with zero reference pressure was assigned to 40% lower region of the hot leg entrance. SF6 mass flow rate of 0.046 kg/s was given to the inlet condition with referencing the test reports [3,4], and a zero reference pressure was set to the

  • utlet condition. A wall condition with a constant heat

transfer coefficient of 500 W/m2K was applied on the

  • uter surface of the SG tubes on the basis of other

research results [4,6]. In addition, an ambient temperature of 338 K was applied to calculate the convective heat transfer in the secondary side of the steam generator. A total of about 29,025,136 cells with a cell length of 2 - 10 mm were generated in the grid model.

  • Fig. 3. Grid Model for the WH 1/7 Test Facility
  • Fig. 4. Boundary Conditions applied on the Grid Model

The natural convection flow in the SG inlet plenum during the convective flow from the hot leg to SG tubes imposed by the boundary conditions was solved by applying the mass conservation, momentum conservation with a buoyancy model (Eq. (1)), energy conservation implemented in the ANSYS CFX 19.1 [7]. A turbulent flow was modeled by the shear stress transport (SST) model with the scalable wall function. A turbulence generation owing to the buoyancy force (Eq. (2)) was included in the turbulence production term of the SST model. A steady state calculation was performed to obtain the converged solutions through approximately 2500 iterations after completing a transient calculation of about 200 s. We assumed that the convergence criteria were satisfied when the normalized pressure, velocity, turbulence, and enthalpy residual reached approximately 1.0  10-4.

(1)

(2) 3.2 Discussion on the CFD Results The CFD results for the SG-S3 test conducted in the WH 1/7 test facility are shown in Fig. 5 and Table 3. Fig. 5(a) shows the temperature distribution on the center

Tube sheet Hot Leg

 

   

i j j i i eff ref j j i j j i

U U U U U P g t x x x x x                                        

SF6

IP-1 IP-5 OP-1 OP-2 OP-6 IP-11 IP-51 IP-47 IP-32 IP-40

Transactions of the Korean Nuclear Society Virtual Spring Meeting July 9-10, 2020

slide-3
SLIDE 3

Transactions of the Korean Nuclear Society Virtual Spring Meeting July 9-10, 2020

plane from the hot leg to SG inlet plenum. The higher temperature alone the upper region in the hot leg is formed by the hot SF6 flowing to the SG inlet plenum. The lower temperature on the lower region in the hot leg is resulted from the returning flow from the SG after losing its heat through convective heat transfer when it flows along the SG tubes. From Figs. 5(b) and (c), we can know that the hotter fluid from the hot leg mixes with the colder fluid during its moving upward to the SG tube entrance in the SG inlet plenum. Through this thermal mixing process, the hotter fluid extends its flow width

  • wing to the entrained colder fluid. In addition, the

heated fluid flowing to the hot leg through this thermal mixing turns its flow direction at the lower region in the SG inlet plenum and starts to move upward due to the buoyancy force. As a result of this process, the hotter fluid with approximately 350–386 K enters into the tubes in the right region of the tube sheet (Fig. 5(d), A) whereas the colder fluid flows downward through the other region.

  • Fig. 5(e) shows the comparison of SF6 temperatures at

the measured TC locations between the test datum and CFD results. The comparison result shows that the CFD result predicts lower temperature at the yellow region in

  • Fig. 5(d). This may be explained by the fact that the

buoyant jet flow from the hot leg moves upward steeply such as Fig. 5(c) A than the measured flow in the test data. Table 3 shows comparison of major parameters including the MELCOR inputs between the test data and the calculated CFD results [4,5,8]. According to the comparison results, the CFD results accurately predicts the measured data with an error range of approximately 10%. In the judgement of the number of the hot tube in the CFD analysis, we assume as the hot tube if the hotter SF6 flows through approximately 20% to 100% area of the total cross sectional area.

(a) Temperature distribution on the center plane of the hot leg and SG inlet plenum (b) Temperature distribution in the SG inlet plenum (c) Velocity profile in the SG inlet plenum (d) Temperature distribution at the SG tube entrance *Temp. unit : oC (Test : Black, CFD : Red) **ID locations are shown in Fig. 2 (e) Comparison of SF6 temperatures between test SG-S3 and CFD results

  • Fig. 5. Predicted Temperature and Velocity by CFX-19.1

SF6 A A

slide-4
SLIDE 4

Table 3: Comparison between Test Data and CFD Results Parameter Test CFD Heat loss at tubes [kW] 3.56 3.55

  • Numb. of hot tubes

75 82

  • Numb. of cold tubes

141 134 Th in center of the hot leg (average) [K] 432.4 428.0 Tc in center of the hot leg (average) [K] 359.9 352.3 Mass flow rate in center of the hot leg (m) (flowing to SG) 0.060 0.053 Tht in tubes at tube sheet (average) [K] 373.9 373.5 Tct in tubes at tube sheet (average) [K] 337.8 337.8 mt in the SG tubes 0.120 0.106 mt / m (Recirculation ratio) 2.01 2.00 f (mixing fraction) 0.85 0.82

  • 4. Conclusions and Further Work

KAERI performed a CFD calculation of the natural convective flow in the SG inlet plenum of the WH 1/7 test facility to establish an analysis methodology for applying to the CFD analysis of the natural circulation flow from the hot let to SG inlet plenum in an OPR1000. We developed the analysis methodology to predict the MELCOR input parameters with an error range of approximately 10%. As a further work, we will have to investigate the temperature difference at the middle region of the tube sheet in the SG inlet plenum between the test data and CFD results. ACKNOWLEDGMENTS This work was supported by the National Research Foundation of Korea (NRF) grant funded by the Korea government (Ministry of Science, ICT, and Future Planning) (No. 2017M2A8A4015280) REFERENCES [1] S. I. Kim, Evaluation of Steam Generator Tube Rupture Accident Sequence Analysis, KAERI/TR- 7852/2019, Technical Report, KAERI, 2019. [2] H. S. Kang, S. I. Kim, and E. H. Ryu, Preliminary CFD Analysis for a natural circulation flow between a reactor and steam generator in an OPR1000, KAERI/TR- 7975/2019, Technical Report, KAERI, 2019. [3] W. A. Stewart, A. T. Pieczynski, and V. Srinivas, Natural Circulation Experiments for PWR High- Pressures Accidents, TR-102815, Technical Report, EPRI, 1993. [4] C. F. Boyd and K. Hardesty, CFD Analysis of 1/7th Scale Steam Generator Inlet Plenum Mixing During a PWR Severe Accident, NUREG-1781, Technical Report, U.S.NRC, 2003. [5] D. B. Ebeling-Koning et al., “Steam Generator Inlet Plenum Mixing Model for Severe Accident Natural Circulation Conditions”, ASME Winter Meeting, Dallas, Texas, 1990. [6] A. Dehbi and H. Badreddine, “CFD Prediction of Mixing in a Steam Generator Mocl-up: Comparison between Full Geometry and Porous Medium Approaches”, Annals of Nuclear Energy, 58, pp. 178- 187, 2013. [7] Ansys Inc., ANSYS CFX-19 Manual, 2018. [8] C. F. Boyd and K. W. Armstrong, Computational Fluid Dynamics Analysis of Natural Circulation Flows in a Pressurized-Water Reactor Loop under Severe Accident Conditions, NUREG-1922, Technical Report, U.S.NRC, 2010.

Transactions of the Korean Nuclear Society Virtual Spring Meeting July 9-10, 2020