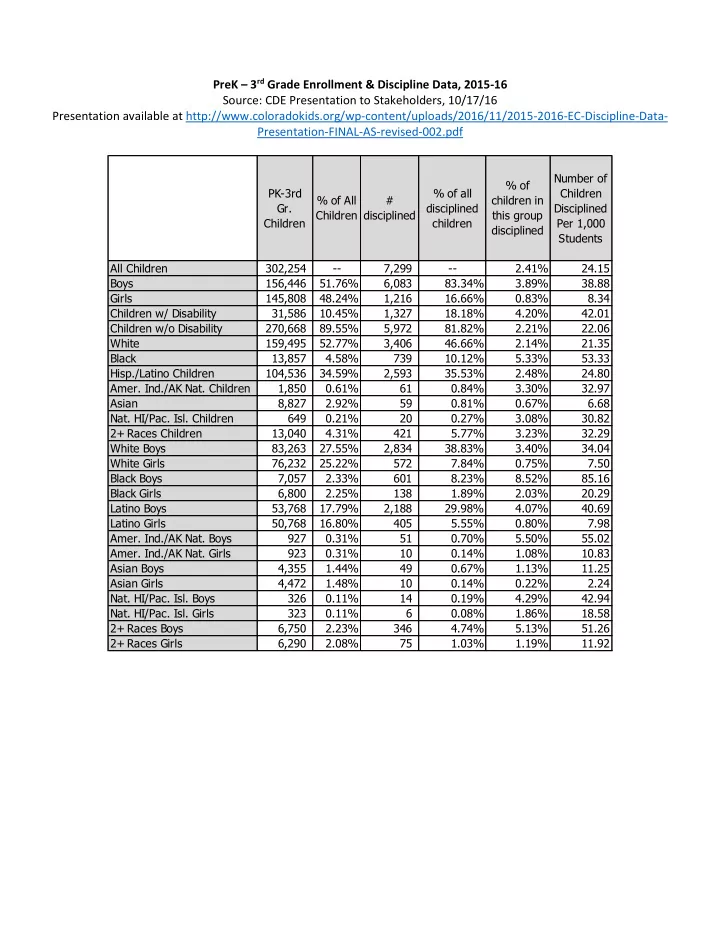
prek 3 rd grade enrollment amp discipline data 2015 16
play

PreK 3 rd Grade Enrollment & Discipline Data, 2015-16 Source: - PDF document

PreK 3 rd Grade Enrollment & Discipline Data, 2015-16 Source: CDE Presentation to Stakeholders, 10/17/16 Presentation available at http://www.coloradokids.org/wp-content/uploads/2016/11/2015-2016-EC-Discipline-Data-


  1. PreK – 3 rd Grade Enrollment & Discipline Data, 2015-16 Source: CDE Presentation to Stakeholders, 10/17/16 Presentation available at http://www.coloradokids.org/wp-content/uploads/2016/11/2015-2016-EC-Discipline-Data- Presentation-FINAL-AS-revised-002.pdf Number of % of PK-3rd % of all Children % of All # children in Gr. disciplined Disciplined Children disciplined this group Children children Per 1,000 disciplined Students All Children 302,254 -- 7,299 -- 2.41% 24.15 Boys 156,446 51.76% 6,083 83.34% 3.89% 38.88 Girls 145,808 48.24% 1,216 16.66% 0.83% 8.34 Children w/ Disability 31,586 10.45% 1,327 18.18% 4.20% 42.01 Children w/o Disability 270,668 89.55% 5,972 81.82% 2.21% 22.06 White 159,495 52.77% 3,406 46.66% 2.14% 21.35 Black 13,857 4.58% 739 10.12% 5.33% 53.33 Hisp./Latino Children 104,536 34.59% 2,593 35.53% 2.48% 24.80 Amer. Ind./AK Nat. Children 1,850 0.61% 61 0.84% 3.30% 32.97 Asian 8,827 2.92% 59 0.81% 0.67% 6.68 Nat. HI/Pac. Isl. Children 649 0.21% 20 0.27% 3.08% 30.82 2+ Races Children 13,040 4.31% 421 5.77% 3.23% 32.29 White Boys 83,263 27.55% 2,834 38.83% 3.40% 34.04 White Girls 76,232 25.22% 572 7.84% 0.75% 7.50 Black Boys 7,057 2.33% 601 8.23% 8.52% 85.16 Black Girls 6,800 2.25% 138 1.89% 2.03% 20.29 Latino Boys 53,768 17.79% 2,188 29.98% 4.07% 40.69 Latino Girls 50,768 16.80% 405 5.55% 0.80% 7.98 Amer. Ind./AK Nat. Boys 927 0.31% 51 0.70% 5.50% 55.02 Amer. Ind./AK Nat. Girls 923 0.31% 10 0.14% 1.08% 10.83 Asian Boys 4,355 1.44% 49 0.67% 1.13% 11.25 Asian Girls 4,472 1.48% 10 0.14% 0.22% 2.24 Nat. HI/Pac. Isl. Boys 326 0.11% 14 0.19% 4.29% 42.94 Nat. HI/Pac. Isl. Girls 323 0.11% 6 0.08% 1.86% 18.58 2+ Races Boys 6,750 2.23% 346 4.74% 5.13% 51.26 2+ Races Girls 6,290 2.08% 75 1.03% 1.19% 11.92

  2. Number of Children Disciplined by Demographic Group (per 1,000 students) PreK-3rd Grade, 2015-16 (Source: Colorado Department of Education) 90 80 70 60 50 40 30 PreK-3rd Grade Average 20 10 0 CDE presentation available at http://www.coloradokids.org/wp-content/uploads/2016/11/2015-2016-EC-Discipline-Data- Presentation-FINAL-AS-revised-002.pdf)

  3. PreK-3 rd Grade Enrollment vs. Discipline By Subgroup 2015-16 School Year, Source: Colorado Department of Education Presentation Available at http://www.coloradokids.org/wp-content/uploads/2016/11/2015-2016-EC-Discipline-Data- Presentation-FINAL-AS-revised-002.pdf 90% 83% 20% 35% 18% 30% 18% 80% 30% 16% 70% 25% 14% 60% 52% 48% 12% 10% 18% 20% 50% 10% 40% 15% 8% 30% 6% 10% 17% 20% 4% 5% 10% 2% 0% 0% 0% Girls Boys Children w/ Disability Latino Boys 4.7% 0.25% 5.0% 12% 10% 4.5% 0.19% 10% 0.20% 4.0% 3.5% 8% 0.15% 3.0% 2.2% 0.11% 2.5% 6% 5% 0.10% 2.0% 4% 1.5% 0.05% 1.0% 2% 0.5% 0.00% 0.0% 0% Nat. HI/Pac. Isl. Boys 2+ Races Boys Black Children 0.80% 9.0% 8.2% Legend 0.70% 8.0% 0.70% Pct. Of Children Pct. Of Children 7.0% 0.60% Enrolled Disciplined 6.0% PreK-3 rd Gr. 0.50% PreK-3 rd Gr. 5.0% 0.40% 0.31% 4.0% 0.30% 3.0% 2.3% 0.20% 2.0% 0.10% 1.0% 0.00% 0.0% Amer. Ind./AK Nat. Boys Black Boys

Download Presentation
Download Policy: The content available on the website is offered to you 'AS IS' for your personal information and use only. It cannot be commercialized, licensed, or distributed on other websites without prior consent from the author. To download a presentation, simply click this link. If you encounter any difficulties during the download process, it's possible that the publisher has removed the file from their server.

Recommend


More recommend