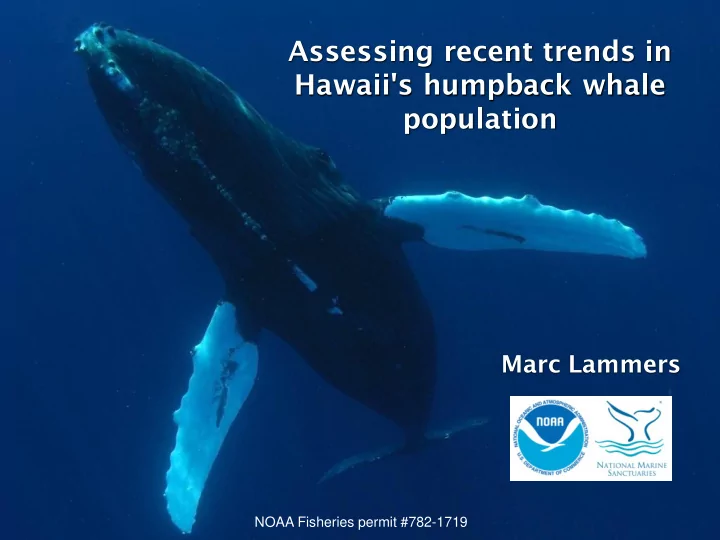
SLIDE 1
Assessing recent trends in Hawaii's humpback whale population
Marc Lammers
NOAA Fisheries permit #782-1719
SLIDE 2 Historical trends in the number
- f whales wintering in Hawaii
2
Prepared by Ed Lyman
SLIDE 3 The 2015/16 whale season
Hawaii News Now
Hawaii News Now
February 2015: 1,488 whales
SLIDE 4 2014/15 2015/16
HIHWNMS/UH/OSI acoustic monitoring
NOAA permit # 782-1719
° ° °
Prepared by Anke Kuegler
SLIDE 5 5
2014/15 2015/16 2016/17 2017/18
- 6 dB = 50% decrease in SPL
HIHWNMS/UH/OSI acoustic monitoring
° ° °
Prepared by Anke Kuegler
SLIDE 6 HIHWNMS/UH/OSI acoustic monitoring
100 105 110 115 Nov Dec Jan Feb Mar Apr Average RMS SPL (dB re 1 µPa, running averagemn=10) Olowalu 100 105 110 115 120 Nov Dec Jan Feb Mar Apr Average RMS SPL (dB re 1 µPa, running averagemn=10) Kahekili 90 100 110 120 Nov Dec Jan Feb Mar Apr Average RMS SPL (dB re 1 µPa, running averagemn=10) MM17 100 105 110 115 Nov Dec Jan Feb Mar Apr Average RMS SPL (dB re 1 µPa, running averagemn=10) Molokini
2014/15 2015/16 2016/17 2017/18
° ° °
Olowalu Kahekili MM17 Molokini Prepared by Anke Kuegler
SLIDE 7 Sanctuary Ocean Count
http://hawaiihumpbackwhale.noaa.gov/involved/ocprojectresults.html
Prepared by Anke Kuegler
SLIDE 8 A path forward...
Expert workshop on recent trends in humpback whale occurrence
- Organized and hosted by NOAA’s HIHWNMS & PIRO
- Held in Honolulu November 27-28, 2018
- Included >30 researchers and resource managers from Hawaii
and Alaska representing 17 institutions & agencies
SLIDE 9 9
- Present data on reported changes in humpback whale sighting
rates over the past 3-4 years
- Consider potential explanations for the observed trends
- Identify knowledge gaps and establish research priorities for
filling those gaps
- Evaluate strategies and establish a consensus on a way forward
Workshop objectives: Workshop on humpback whale trends objectives
SLIDE 10 1
Workshop on humpback whale trends meeting agenda Presentations Brainstorming discussions
SLIDE 11 Keiki Kohola Project data
Courtesy of Rachel Cartwright
Cartwright, R., A. Venema , V. Hernandez, C. Wyels, J. Cesere,
- D. Cesere. 2019. Fluctuating reproductive rates in Hawaii’s
humpback whales, Megaptera novaeangliae, reflect recent climate anomalies in the North Pacific. Royal Society Open Science; 6: 181463.
Mothers & calves Adult groups
SLIDE 12
Hawaii Marine Mammal Consortium data
Scan Numbers 2001- 2018
Whales Calves Courtesy of Adam Frankel
SLIDE 13
Alaska Researchers
Chris Gabrielle – SEAK Jan Straley/John Moran – PWS
SLIDE 14
- Whale counts from SEAK and Prince William Sound, HI island, and Maui all
show strong decreases in sighting rates over the last 4-5 years. This affects both adults and calves
- Trends in other parts of the Pacific are still unclear
- Changes in prey abundance/distribution are suspected to be playing a role
- Unknowns that need to be resolved:
- Are decreases in whale numbers reflecting changes in habitat use or a
decline in the population?
- Does this reflect a broader trend across the central N. Pacific population?
- Are these changes linked to declines in other species and/or
- ceanographic changes?
Workshop conclusions:
Workshop on humpback whale trends meeting outcomes
SLIDE 15
Google: “sciencemag blob”
Workshop on humpback whale trends meeting outcomes
2015
Gentemann, C., et al. Geophysical Research Letters 44.1, 312, (2017)
SLIDE 16
- Investigate whether whales are going somewhere else to breed or feed
- Assess body condition to establish whether health is a factor in
decreased sightings
- Determine whether reproductive rates, abundance, and survival have
changed over time
- Identify possible changes in quality, quantity, and distribution of food
resources
- Investigate the role of environmental and anthropogenic factors in all of
the above Identified top research priorities:
Workshop on humpback whale trends meeting outcomes
SLIDE 17 Workshop on humpback whale trends meeting outcomes
Direct outcomes of workshop to date:
- 8 working groups have been formed among
participants to formulate research plans and partnerships
- Coordinated aerial, vessel, shore-based &
acoustic surveys took place this season
- A collaborative AUV effort is underway in HI
and AK to examine trends in body condition
- Acoustic monitoring is occurring across the
Hawaiian archipelago (including NWHI)
- Discussions have started across management
agencies
SLIDE 18
Epilogue: 2019 season
2015 2016 2017 2018 2019
Sanctuary Ocean Count
SLIDE 19 Epilogue: 2019 season
90 100 110 120 Nov Dec Jan Feb Mar Apr Average RMS SPL (dB re 1 µPa, running averagemn=10) MM17 95 100 105 110 115 Nov Dec Jan Feb Mar Apr Average RMS SPL (dB re 1 µPa, running average n=10) Olowalu
2014/15 2015/16 2016/17 2017/18 2018/19
° ° °
SLIDE 20
Epilogue: 2019 season
Scan Numbers 2001- 2019
Whales Calves Courtesy of Adam Frankel
2019 count
SLIDE 21
Epilogue: 2019 season
Encounter rate whale counts are comparable to 2003 levels (about half of what would be predicted based on 7% annual increase)
Courtesy of Joe Mobley
SLIDE 22 Epilogue: 2019 season
- Approximately 180 whales sighted, including at least 13 calves
- 47 fluke IDs and 10 biopsy samples were collected
SLIDE 23 Summary
- The Hawaii DPS has experienced notable fluctuations in whale
distribution and/or numbers since de-listing in 2016
- The proximate causes of these fluctuations are still TBD, but
changes in prey availability and ocean warming are strongly implicated
- Discussions among Hawaii and Alaska researchers and resource
managers have identified research priorities and resulted in efforts to better understand the situation
SLIDE 24
ACKNOWLEDGEMENTS
Ann Allen (PIFSC) Cindy Among-Serao (HIHWNMS) Shannon Atkinson (UAF) Lars Bejder (HIMB) Jessica Chen (NAVFAC) Jens Currie (PWF) Jim Darling (Whale Trust) Mark Deakos (HDR) Fabien Delarue (HIMB) Adam Frankel (HMMC) Chris Gabriele (NPS) Beth Goodwin (JRF) Megan Jones (Whale Trust)
NOAA permit #18786-01
Anke Kuegler (UHM) Ed Lyman (HIWHNMS) Bruce Mate (OSU) Joe Mobley (UHM) John Moran (AFSC) Janet Nielsen (NPS) Erin Oleson (PIFSC) Adam Pack (UHH) Shannon Yee (NMSF) Aude Pacini (HIMB) Susan Pultz (PIRO) Jan Straley (UAS) Dan Pelacios (OSU) Andy Szabo (AWF) Stephanie Stack (PWF) Paul Wong (HIHWNMS)