
SLIDE 1
879,170
- 200,000
Population of Studied Municipalities U.S. Census Bureau Estimate - - PowerPoint PPT Presentation
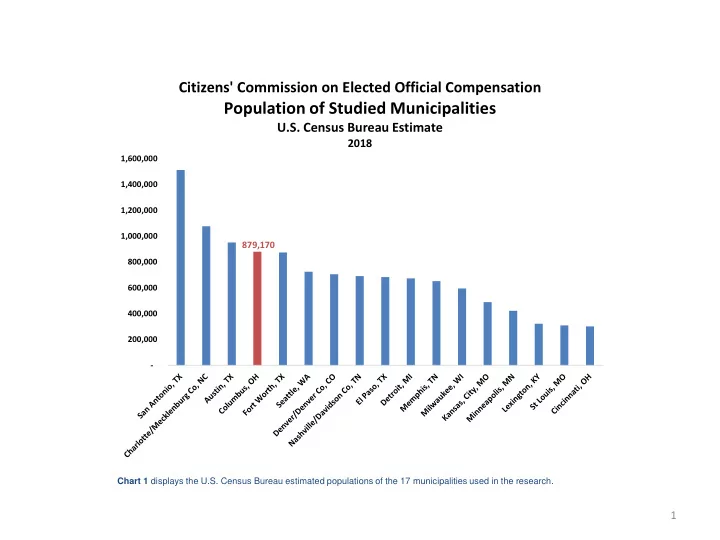
Citizens' Commission on Elected Official Compensation Population of Studied Municipalities U.S. Census Bureau Estimate 2018 1,600,000 1,400,000 1,200,000 1,000,000 879,170 800,000 600,000 400,000 200,000 - Chart 1 displays the U.S.
*Municipalities with city managers and mayors **Current mayor chose not to be Chart 5 displays a mayor’s salary as a percentage of the FY2018 general fund budget of the respective municipality.
*Current mayor chose not to be t d Chart 8 displays the salaries of all chief executives (mayor and city manager) as a percentage of the FY2018 general fund budget of the respective municipality.
*Municipality has no current il id t Chart 14 displays a council president’s salary as a percentage of the FY2018 general fund budget
*Previous incumbent’s
currently vacant.
*Previous incumbent’s
currently vacant.
*Previous incumbent’s
currently vacant.