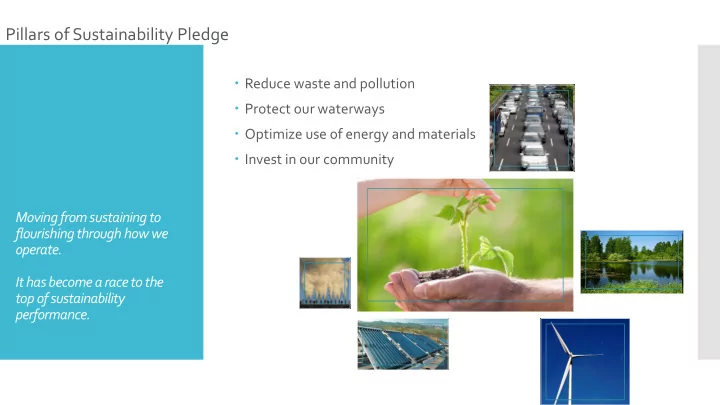
SLIDE 1 Reduce waste and pollution Protect our waterways Optimize use of energy and materials Invest in our community
Pillars of Sustainability Pledge
Moving from sustaining to flourishing through how we
It has become a race to the top of sustainability performance.
SLIDE 2 Value Engagement Trust Competitive Advantage New generation employees .
Why we measure
An active approach to corporate sustainability reaps value in the form of reputation building, cost savings, and growth
SLIDE 3 Metrics that matter Investment Resilience
Value- based decision making Positive Impact, Competitive advantage Plan Metrics Education
Thriving Business
Engagement
Corporate goals are being aligned with environmental and social responsibility. Consumers and investors are paying attention. Accountability & transparency to stakeholders Improving public perception and brand image Improving processes, culture, and sustainability technology Competitive Advantage Staying current with best practices and benchmarking performance
SLIDE 4
Defining metrics specific to organization The relationship between the types of metrics and thriving business Regulation can become part of solution Limitations, transparency, relevance Importance of tracking vs progress Internal corporate metrics are developed to meet specific business needs. Companies that communicate not only their successes, but challenges, emerge as strong business leaders.
Metrics that matter
Relevant Actionable Timely Measureable
SLIDE 5
Guidelines Tools DOE FEMP EPA WasteWise Portfolio Manager WaterSense Regulatory Small business EIA CBECS International Organization for Standardization (ISO)
Industry Guidelines
As companies undergo the evolution of sustainability reporting standards and metrics, the presence of targets are less illuminating than whether or not companies are tracking issues.
SLIDE 6
Metrics should be aligned with goals. What are you trying to achieve, and will these metrics give you useful information for that effort. https://www.sce.com/wps/wcm/connect/a80ab052-b9a6-41d8- 895e-9544387725a6/BenchmarkingGuide.pdf?MOD=AJPERES http://www4.uwm.edu/shwec/recyclingtoolkit/PDF/EPATheMeasu reofSuccess_CalculatingWasteReduction.pdf http://carbonfund.org/how-we-calculate http://www3.epa.gov/watersense/commercial/index.html http://www.energy.gov/eere/femp/energy-and-cost-savings- calculators-energy-efficient-products http://www.epa.gov/cleanenergy/energy- resources/calculator.html https://www.globalreporting.org/resourcelibrary/English-Lets- Report-Template.pdf http://www3.epa.gov/epawaste/conserve/tools/warm/Warm_For m.html https://www.energystar.gov/buildings/facility-owners-and- managers/existing-buildings/use-portfolio-manager https://www.eia.gov/ http://www.eia.gov/consumption/commercial/data/2003/#b1 http://www.nist.gov/
Resources
SLIDE 7
Metrics are not just used for demonstrating progress or telling a good story. Metrics are used to gather information for future decisions, understanding how programs are working, and for accountability Electricity Consumed (kWh/year) Alternative Energy Produced (kWh/year)
Include Renewable Energy Certificate (REC)s
Total Fleet Fuel Consumption (gals/year) Total GHG Emissions (OPTIONAL) (metric tons CO2 equiv./year) Water Consumed / Purchased (gals/year) Solid Waste Produced (lbs/year) Employee Volunteerism in Community (hours/year)
SBR Metrics
SLIDE 8
Define, determine, engage. Using metrics to inspire new thinking, innovation, and action. Electricity Blended Rate Customer Demand Energy Energy Intensity Leased Assets Ex. Tenant space 37,000 sqft, total building 100,000 sqft., 100% occupied = 37% total consumption Ex. Tenant space 37, 000 sqft, total building 100,000 sqf, 50% unoccupied = 74% total consumption Assumptions are critical Replicative Transparent Communication
Example
SLIDE 9 Establishing Performance Metrics
Plan performance metrics should answer the following questions: Are we executing our strategy? If we are not executing
are the leading indicators that we will need to provide this information? Do we have the right strategy in place? Metrics must be visible and well integrated with business process
Source: Chris Davis, METIS Strategy (2013) “Managing Through Metrics: The Other Sides of SMART.”
SLIDE 10
WNYSBR Metrics Reporting Form
Creating a baseline allows for a better understanding of potential efficiencies.
SLIDE 11 WNYSBR Metrics Reporting Form
Annual reporting serves as a mechanism to capture savings from both project specific initiatives and overall sustainability
SLIDE 12
Understanding the resources readily available for reporting.
Electric Utility Bill Example - kWh
SLIDE 13
Water Utility Bill Example - Gallons
SLIDE 14
WNYSBR Metrics Reporting Form
SLIDE 15
WNYSBR Metrics Reporting Form
SLIDE 16 Next step: Taking Action
A long term sustainability plan is ineffective without an action plan. Key next steps include: Identifying resources for taking action Establishing an ongoing communication plan Internal and external plans will likely differ Evaluating performance against plan targets Conducting management reviews Continuous improvement
- Understanding of both current state
and future trends is dynamic, so resulting plan should be viewed as a living document
SLIDE 17
On-going assistance to develop plans Metrics Template- SBR Website Templates due March 31, 2016 Questions? Break-out group discussions WNY Sustainable Roundtable Reporting- Member commitment.
In a survey of 272 executives across 24 industries, 76% anticipate natural resource shortages will affect their core business objectives over the next 3-5 years.
SLIDE 18
Trish Donohue, MS, QEP Senior Pollution Prevention Engineer Sustainable Supply Chain Program Manager New York State Pollution Prevention Institute, at Rochester Institute of Technology Patricia.Donohue@RIT.edu (585)425-4638
Thank You!
NYSP2I: http://www.rit.edu/affiliate/nysp2i/ Aliesa Adelman, CSDP, LEED AP BD+C Sustainable Design Coordinator Wendel
aadelman@wendelcompanies.com