
dunkel@mit.edu
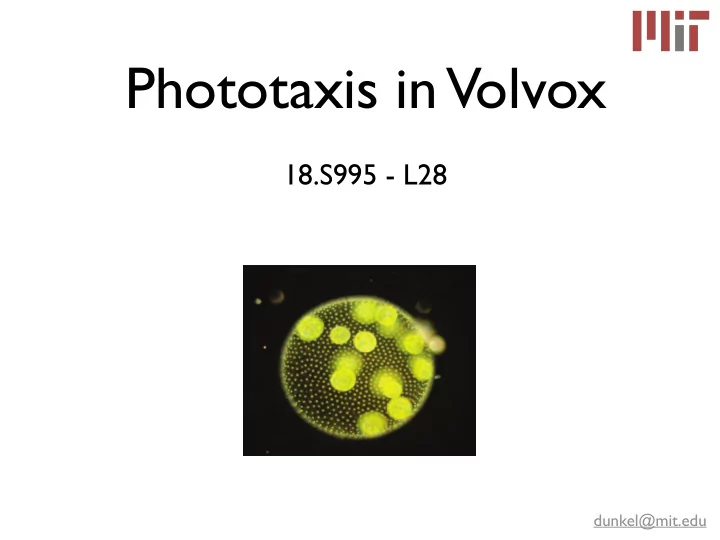
Phototaxis in Volvox
- the beating of thousands of flagellated cells despite the organ
at a frequency that likely coevolved with the organism’s flagel flagellar beating of the organisms, the authors measured the fluid velocities produced by the flagella and modeled the mo thors identified a theoretical optimal spinning frequency and tested the finding experimentally by observing how well the , flagellar beating and spinning are linked adaptations. By better understanding how simple organisms coordinate multicellular processes, the findings may provide insight into key evolutionary steps March (pp. 11260–11264) modified fied Nissle to 2- to 3-day–old mice modified Nissle pretreatment. The Francis McCubbin et al. (pp. 11223– tified apatite grains in thin sections can be occupied by fluorine, chlorine, tive amounts of fluorine, chlorine, and
18.S995 - L28