
SLIDE 1 1
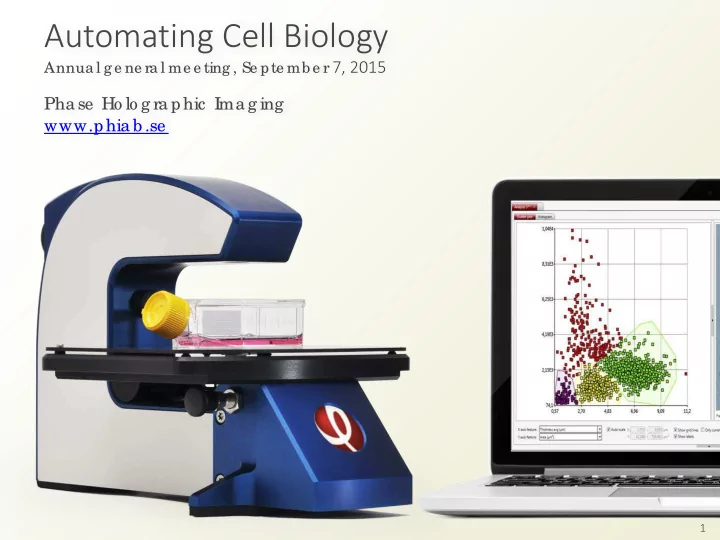
Automating Cell Biology
Annua l g e ne ra l me e ting , Se pte mb e r 7, 2015
Pha se Ho lo g ra phic I ma g ing www.phia b .se
Phase PHASE HOL OGRAPHI C I MAGI NG (PHI ) Began as a - - PowerPoint PPT Presentation
Automating Cell Biology Annua l g e ne ra l me e ting , Se pte mb e r 7, 2015 Pha se Ho lo g ra phic I ma g ing www.phia b .se 1 Ho lo g raphic I mag ing Phase PHASE HOL OGRAPHI C I MAGI NG (PHI ) Began as a research project at
Automating Cell Biology
Annua l g e ne ra l me e ting , Se pte mb e r 7, 2015
Pha se Ho lo g ra phic I ma g ing www.phia b .se
Phase
Ho lo g raphic I mag ingPHASE HOL OGRAPHI C I MAGI NG (PHI )
PHI leads the ground-breaking development of time-lapse cytometry instrumentation and software. With the first instrument introduced in 2011, the company today offers a range of products for long- term quantitative analysis of living cell dynamics that circumvent the drawbacks of traditional methods requiring toxic stains. Headquartered in Lund, Sweden, PHI trades through a network of international distributors. Committed to promoting the science and practice of time-lapse cytometry, PHI is actively expanding its customer base and scientific collaborations in cancer research, inflammatory and autoimmune diseases, stem cell biology, gene therapy, regenerative medicine and toxicological studies.
Phase
Ho lo g raphic I mag ingWHAT I S CE L L CUL T URE ?
cornerstone of drug development and preclinical research
to work on human cells before clinical trials
artificially cultured in plastic containers inside a cell incubator
Cell culturing in a cell incubator Cell culture preparation
Phase
Ho lo g raphic I mag ingCE L L ANAL YSI S
when fixed and dead – fixed c cell analysi sis
cell analysi sis s allows investigation of dynamic processes of living cells instead of only providing a “snapshot” of a cell’s current state
eled ed with chemicals or genetic modifications which emit light
enabling repeated observations of the same cells over time – label el-free l ee live e cell a analysis
Intoxicated humans do not display their natural behavior. The same applies to their building blocks – cells
Phase
Ho lo g raphic I mag ingMARK E T SI ZE
“Cell Analysis Flourishes Scientifically, Prospers Commercially”
Genetic Engineering and Biotechnology news, 2015“The global market is estimated to be valued at $8.7 billion USD in 2013 and will grow at a CAGR of 11.1% from 2013 to 2018”
Cell-based Assays Market by Product, Application, End-user, Markets & Markets, 2014Estimated number of labs performing cell analysis worldwide = 126 804
The Market for Cell-based Assays, Bioinformatics, gene2drug.com, 2015 North America 50% Europe 26% Asia 19% RoW 5% Academia 33% Pharma Biotech 48% Contract Research 16% Other 2% Cell-based Assays Market by Product, Application, End-user, Markets & Markets, 2014Government initiatives and public- private partnerships along with drying drug pipeline in pharma industry have led to increase in drug discovery activities; which is stimulating the market growth. Presently, the market is all set to witness trends such as label el- free d ee det etection, drug discovery out- sourcing, 3D culture and stem cells
Phase
Ho lo g raphic I mag ingK E Y MARK E T T RE NDS
degenerative diseases propel the cell analysis market
electronics and image analysis continue to create market opportunities
cell viability/optimal environment drive automation of cell culture systems
technology with microscopy imaging platforms enables scientists to conduct more biologically relevant investigations, unattainable with conventional techniques
drives the need for new analytical imaging technologies
Present and future cell culturing. Lab-
cultured in a micro-environment.
Phase
Ho lo g raphic I mag ingT ARGE T CUST OME RS
Academic Research
Pharmaceutical
Biotechnology
tobacco, etc.)
HoloMonitor gives a totally new dimension to our work
Phase
Ho lo g raphic I mag ingE ND-POI NT
I ME
APSE CE L L ANAL YSI S
cell culture based experiments are only analyzed at the end of the experiment – end-point cell analysis
monitored and analyzed through out the experiment – time-lapse cell analysis Time-lapse analysis Time End-point analysis Time
Phase
Ho lo g raphic I mag ingMARK E T OPPORT UNI T Y
End-point c cell a analysi sis
the experiment
Transition from end-point to time-lapse cell analysis
Time-lapse of a dividing cell
Time me-la lapse c cell ell analy lysis is
the experiment
data points
Time-lapse microscopy allows cell based preclinical research to transition from end-point to time-lapse cell analysis Quantifying over time is crucial for a full understanding
will enable the next level of insight
Phase
Ho lo g raphic I mag ingT I ME
APSE MI CROSCOPY
movies of living cells
time-lapse recording and analysis challenging in practice
1. Cultured cells quickly die outside an incubator environment 2. To keep the cells in focus some type of autofocus is needed 3. Toxic stains are needed to automatically track cells 4. Cytometric software is needed to process the huge amount of data in time-lapse movies 5. Toxic stains are needed to quantitatively observe molecular specificityAddressed i issues Microscope type Cost
(K USD) 1 2 3 4 5Conventional +10 Low-end time-lapse ~10
√
High-end time-lapse +100
√ √
Phase H Hologr graphic ic I Imagin ging 20 20 -
√ √ √ √ √
Phase
Ho lo g raphic I mag ingHOL OMONI T OR M4
Label-free live cell analysis
The HoloMonitor platform offers unique 4-dimensional imaging capabilities that greatly enhance our understanding of both functions, which was previously unachievable by other technologies
Ed Luther, Northeastern University, Boston
Phase
Ho lo g raphic I mag ingHOL OMONI T OR M5
are toxic, especially when activated
the activation of fluorescent labels can be dramatically reduced to minimize the toxic effect on cell behavior
Funding is provided by the Swedish Research Council (Vetenskapsrådet)
Minimally invasive live cell analysis
Fluorescent labelled cells
Phase
Ho lo g raphic I mag ingAddressed i issues Microscope type Cost (K USD)
1: Incubator environment 2: Autofocus 3: No toxic stains needed to track cells 4: Cytometric software 5: No toxic stains needed to observe molecular specificityConventional +10 Low-end time-lapse ~10
√
High-end time-lapse +100
√ √
Competing holographic ~50 -100
√ √
Ho HoloMonit itor M4 M4 20 20-35 35
√ √ √ √
Ho HoloMonit itor M5 M5
√ √ √ √ √
COMPE T I T I ON
Mi Microscope type Suppliers Conventional
Nikon, Olympus, Zeiss
Low-end time-lapse
Small technology companies (NanoEntek, Etaluma, CytoMate)
High-end time-lapse
Nikon, Olympus, Zeiss, Thermo Fisher, GE Healthcare
Competing holographic
Small technology companies (Ovizio, Lynceé Tec, NanoLive)
Phase
Ho lo g raphic I mag ingHST UDI O
been reported by customers
additional revenue source Proprietary cell analysis software
Cell incubator with multiple HoloMonitor Single Hstudio license for data collecting Database server Multiple Hstudio licenses for distributed data analysis
Phase
Ho lo g raphic I mag ingCONSUMABL E S PI PE L I NE
culture vessels is needed
The PHI petri dish lid eliminates disturbances from condensation droplets and surface vibrations
Phase
Ho lo g raphic I mag ingI NT E L L E CT UAL PROPE RT Y
Phase
Ho lo g raphic I mag ing– initial sales in key markets: US, Germany, Switzerland, UK, Japan and China – collaborations with key opinion leaders
– Boston, San Diego, San Francisco – London, Basel, Heidelberg – Tokyo
E XI T ST RAT E GY
Phase
Ho lo g raphic I mag ingSUMMARY
to transition from end-point to time-lapse cell analysis
billion USD
– increase sales, – expand strategic marketing and – divest the business
Time-lapse cytometry for biologists, by biologists
Thank You
www.phiab.se