
SLIDE 1
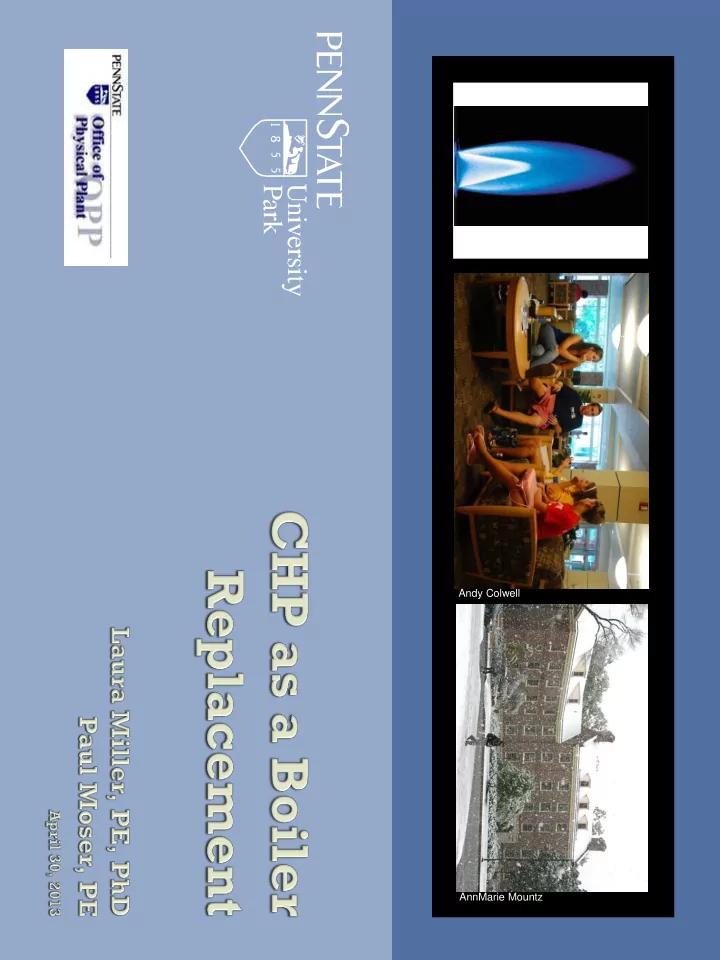
AnnMarie Mountz Andy Colwell
Penn State is a World Class University with more than 50,000 - - PDF document
Andy Colwell AnnMarie Mountz Penn State is a World Class University with more than 50,000 students, faculty and staff on campus on any given day. As a provider of utilities, Steam Services plays an important supporting role in the success of
AnnMarie Mountz Andy Colwell
3/19/10
2
3/19/10
Power Plants
18 Operators 8 daylight maintenance 6 Coal and Ash handlers 2 supervisors
Distribution
7 Daylight Maintenance 1 supervisor
2 Staff Assistants
4/30/2013
3
3/19/10
4/30/2013
4
3/19/10
Additional Steam Capacity
Aging Infrastructure
Essential Services
4/30/2013
5
3/19/10
4/30/2013
6
3/19/10
4/30/2013
7
3/19/10
Combustor
7mW SOLAR TAURUS 70 air Natural gas or
900 oF exhaust Steam to campus
32 kpph un-fired 117,000 kpph fired
RENTEC HRSG
4/30/2013
8
3/19/10
Combustion Turbine
HRSG
Total Project
4/30/2013
9
3/19/10
Covers
Costs
4/30/2013
10
3/19/10
Purchased Electricity (kWh) 96% Electricity Generated (kWh) 4%
Before ECSP Upgrades Prior to 2011
Purchased Electricity (kWh) 79% Electricity Generated (kWh) 21%
After ECSP CHP After 2011
Purchased Electricity (kWh) 67% Electricity Generated (kWh) (CHP at WCSP) 33%
WCSP Upgrades w/ CHP sometime after 2015
11
3/19/10
Coal (mmBtu) 96% Gas (mmBtu) 4%
Before ECSP Upgrades prior to 2011
Coal (mmBtu) 77% Gas (mmBtu) 23%
After ECSP Upgrades after 2011
Coal (mmBtu) 38% Gas (mmBtu) 62%
WCSP Upgrades, Phase 1 2014
Coal (mmBtu) 0% Gas (mmBtu) 100%
WCSP Upgrades, Phase 2 After 2015
4/30/2013
12
3/19/10
4/30/2013
13
3/19/10
4/30/2013
14
3/19/10 500,000 1,000,000 1,500,000 2,000,000 2,500,000 3,000,000 3,500,000 MMBtu
Actual Consumption MMBTUs
OIL NGAS COAL ELECTRIC
4/30/2013
15
3/19/10 350,000 400,000 450,000 500,000 550,000 600,000 mt CO2e / yr
Greener Grid (AEPS)
End Renewable Energy Credits Purchase
Energy Program $7-10M\yr - Energy Savings Projects 15 yr simple payback $1-1.5M\yr - Energy Conservation Measur & and Continuous Commisioni 5 yr simple payback Campus Sustainability Combustion Turbine \ Operational changes Fuel Switch -Coal to Natural Gas Boiler MACT regulatory response $20M - 2nd Combustion Turbine 2012 Goal - 17.5% 30% below 2005 baseline 35% below 2005 baseline Transportation \ Waste Initiatives Green Design
4/30/2013
16
3/19/10
100,000 150,000 200,000 250,000 Prior to 2011 After 2011 Beginning 2014 After 2015 before ECSP Changes After ECSP CHP WCSP Ph 1 WCSP Ph2
4/30/2013
17
3/19/10
4/30/2013
18
3/19/10
4/30/2013
19
3/19/10
exhaust 4 x 100 kpph Boiler 400 oF
Fans Pumps Electric Generation 150-170 psig To Campus To Campus
4/30/2013
20
3/19/10
4/30/2013
21
New Natural Gas Boilers
3/19/10
4/30/2013
22
Future CT/HRSG
3/19/10
4/30/2013
23
3/19/10
4/30/2013
24
Cost $20M $20M Ngas/dth $13 $5 Elect/kWh $0.04 $0.08 Coal/ton $80 ($3.20 per mmBtu) $125 ($5 per mmBtu) Funding Essential Services - Aug 2003 Utilities - Boiler Replacement Energy Funds At the expense of building improvements
3/19/10
$0 $2 $4 $6 $8 $10 $12
2013/ 2014 2014/ 2015 2015/ 2016 2016/ 2017 2017/ 2018
MILLIONS OF DOLLARS Support Sustainability & Academics Utilities Projects Lighting Major Construction Energy Initiatives Buidlings (Includes H&F)
4/30/2013
25
3/19/10
$0 $2 $4 $6 $8 $10 $12
2013/ 2014 2014/ 2015 2015/ 2016 2016/ 2017 2017/ 2018
MILLIONS OF DOLLARS CT/HRSG Utilities - Ag Digester Lighting Major Construction Energy Initiatives Buidlings (Includes H&F)
4/30/2013
26
3/19/10 350,000 400,000 450,000 500,000 550,000 600,000 mt CO2e / yr
Greener Grid (AEPS)
End Renewable Energy Credits Purchase
Energy Program $7-10M\yr - Energy Savings Projects 15 yr simple payback $1-1.5M\yr - Energy Conservation Measur & and Continuous Commisioni 5 yr simple payback Campus Sustainability Combustion Turbine \ Operational changes Fuel Switch -Coal to Natural Gas Boiler MACT regulatory response $20M - 2nd Combustion Turbine 2012 Goal - 17.5% 30% below 2005 baseline 35% below 2005 baseline Transportation \ Waste Initiatives Green Design
4/30/2013
27
3/19/10
4/30/2013
29