
SLIDE 1
Patterns of Evolution
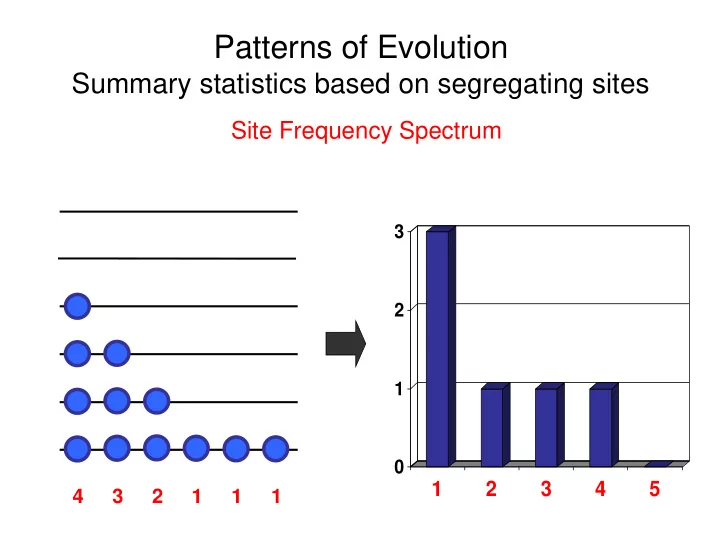
Summary statistics based on segregating sites
Site Frequency Spectrum
4 3 1 2 1 1
1 2 3
1 2 3 4 5
Patterns of Evolution Summary statistics based on segregating sites - - PowerPoint PPT Presentation
Patterns of Evolution Summary statistics based on segregating sites Site Frequency Spectrum 3 2 1 0 1 2 3 4 5 4 3 2 1 1 1 Patterns of Evolution Summary statistics based on segregating sites Site Frequency Spectrum number of
4 3 1 2 1 1
1 2 3
1 2 3 4 5
total number of segregating sites in an sample of size n number of mutants that appear in i copies in the sample
1 1
n i i
1 2 3
1 2 3 4 5
i
i
1 1 2
n i i n
average number of pairwise differences
1 1 2
n i i n
total number of segregating sites in an sample of size n number of mutants that appear in i copies in the sample
1 1
n i i
i
Each mutation of size i contributes to divergence in i (n – i) sequence pairs
1 2 3
1 2 3 4 5
i
1 1 1 1
n i n i i n W
singleton estimator:
1 1
n s
Watterson‘s estimator: -based estimator:
i n i n
1 1 1 2
singletons of the folded spectrum
i n i n H
1 1 2 1 2
Fay and Wu‘s estimator: (equal weights) (intermediate frequencies) (high frequencies) (extreme frequencies)
W W T
Tajima‘s D: Fay and Wu‘s H: Fu and Li‘s D:
S W S W FL
H H FW
0,2 0,4 0,6 0,8 1 1 2 3 4 5 6
T
W W T
Tajima‘s D: Fay and Wu‘s H: Fu and Li‘s D:
S W S W FL
H H FW
0,2 0,4 0,6 0,8 1 1 2 3 4 5 6
T
W W T
Tajima‘s D: Fay and Wu‘s H: Fu and Li‘s D:
S W S W FL
H H FW
0,2 0,4 0,6 0,8 1 1 2 3 4 5 6
FW
W W T
Tajima‘s D: Fay and Wu‘s H: Fu and Li‘s D:
S W S W FL
H H FW
0,2 0,4 0,6 0,8 1 1 2 3 4 5 6
FW