Partial and Autocorrelation Functions Overview Autocorrelation - - PowerPoint PPT Presentation

partial and autocorrelation functions overview
SMART_READER_LITE
LIVE PREVIEW

Partial and Autocorrelation Functions Overview Autocorrelation - - PowerPoint PPT Presentation

Partial and Autocorrelation Functions Overview Autocorrelation Function Defined Normalized Autocorrelation , also known as the Autocorrelation Definitions Function (ACF) is defined for a WSS signal as Properties x ( ) = x ( )


slide-1
SLIDE 1

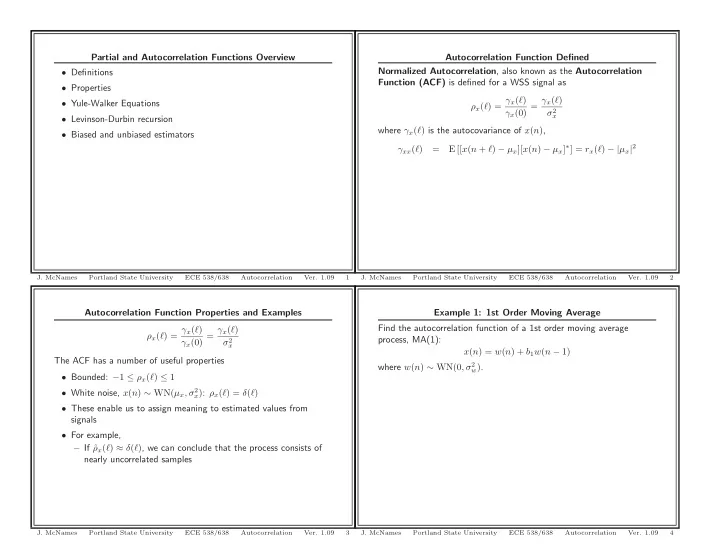
Autocorrelation Function Properties and Examples ρx(ℓ) = γx(ℓ) γx(0) = γx(ℓ) σ2

x

The ACF has a number of useful properties

  • Bounded: −1 ≤ ρx(ℓ) ≤ 1
  • White noise, x(n) ∼ WN(µx, σ2

x): ρx(ℓ) = δ(ℓ)

  • These enable us to assign meaning to estimated values from

signals

  • For example,

– If ˆ ρx(ℓ) ≈ δ(ℓ), we can conclude that the process consists of nearly uncorrelated samples

  • J. McNames

Portland State University ECE 538/638 Autocorrelation

  • Ver. 1.09

3

Partial and Autocorrelation Functions Overview

  • Definitions
  • Properties
  • Yule-Walker Equations
  • Levinson-Durbin recursion
  • Biased and unbiased estimators
  • J. McNames

Portland State University ECE 538/638 Autocorrelation

  • Ver. 1.09

1

Example 1: 1st Order Moving Average Find the autocorrelation function of a 1st order moving average process, MA(1): x(n) = w(n) + b1w(n − 1) where w(n) ∼ WN(0, σ2

w).

  • J. McNames

Portland State University ECE 538/638 Autocorrelation

  • Ver. 1.09

4

Autocorrelation Function Defined Normalized Autocorrelation, also known as the Autocorrelation Function (ACF) is defined for a WSS signal as ρx(ℓ) = γx(ℓ) γx(0) = γx(ℓ) σ2

x

where γx(ℓ) is the autocovariance of x(n), γxx(ℓ) = E [[x(n + ℓ) − µx][x(n) − µx]∗] = rx(ℓ) − |µx|2

  • J. McNames

Portland State University ECE 538/638 Autocorrelation

  • Ver. 1.09

2

slide-2
SLIDE 2

All-Pole Models H(z) = b0 A(z) = b0 1 + P

k=1 akz−k

  • All-pole models are especially important because they can be

estimated by solving a set of linear equations

  • Partial autocorrelation can also be best understood within the

context of all-pole models (my motivation)

  • Recall that an AZ(Q) model can be expressed as an AP(∞)

model if the AZ(Q) model is minimum phase

  • Since the coefficients at large lags tend to be small, this can often

be well approximated by an AP(P) model

  • J. McNames

Portland State University ECE 538/638 Autocorrelation

  • Ver. 1.09

7

Example 2: 1st Order Autoregressive Find the autocorrelation function of a 1st order autoregressive process, AR(1): x(n) = −a1x(n − 1) + w(n) where w(n) ∼ WN(0, σ2

w). Hint: −αnu(−n − 1) Z

← →

1 1−αz−1 for an

ROC of |z| < |α|.

  • J. McNames

Portland State University ECE 538/638 Autocorrelation

  • Ver. 1.09

5

AP Equations Let us consider a causal AP(P) model: H(z) +

P

  • k=1

akH(z)z−k = b0 h(n) +

P

  • k=1

akh(n − k) = b0δ(n)

P

  • k=0

akh(n − k)h∗(n − ℓ) = b0h∗(n − ℓ)δ(n)

  • n=−∞

P

  • k=0

akh(n − k)h∗(n − ℓ) =

  • n=−∞

b0h∗(n − ℓ)δ(n)

P

  • k=0

akrh(ℓ − k) = b0h∗(−ℓ)

  • J. McNames

Portland State University ECE 538/638 Autocorrelation

  • Ver. 1.09

8

Autocorrelation Function Properties ρx(ℓ) = γx(ℓ) γx(0) = γx(ℓ) σ2

x

  • In general, the ACF of an AR(P) process decays as a sum of

damped exponentials (infinite extent)

  • If the AR(P) coefficients are known, the ACF can be determined

by solving a set of linear equations

  • The ACF of a MA(Q) process is finite: ρx(ℓ) = 0 for ℓ > Q
  • Thus, if the estimated ACF is very small for large lags a MA(Q)

model may be appropriate

  • The ACF of a ARMA(P, Q) process is also a sum of damped

exponentials (infinite extent)

  • It is difficult to solve for in general
  • J. McNames

Portland State University ECE 538/638 Autocorrelation

  • Ver. 1.09

6

slide-3
SLIDE 3

Solving the AP Equations If we know the autocorrelation, we can solve these equations for a and b0 ⎡ ⎢ ⎢ ⎢ ⎣ rh(0) r∗

h(1)

· · · r∗

h(P)

rh(1) rh(0) · · · r∗

h(P − 1)

. . . . . . ... . . . rh(P) rh(P − 1) · · · rh(0) ⎤ ⎥ ⎥ ⎥ ⎦ ⎡ ⎢ ⎢ ⎢ ⎣ 1 a1 . . . aP ⎤ ⎥ ⎥ ⎥ ⎦ = ⎡ ⎢ ⎢ ⎢ ⎣ |b0|2 . . . ⎤ ⎥ ⎥ ⎥ ⎦

  • J. McNames

Portland State University ECE 538/638 Autocorrelation

  • Ver. 1.09

11

AP Equations Continued Since AP(P) is causal, h(0) = b0, h∗(0) = b∗

0, and P

  • k=0

akrh(−k) = |b0|2 ℓ = 0

P

  • k=0

akrh(ℓ − k) = ℓ > 0 This has several important consequences. One is that the autocorrelation can be expressed as a recursive relation for ℓ > 0, since a0 = 1:

P

  • k=0

akrh(ℓ − k) = rh(ℓ) = −

P

  • k=1

akrh(ℓ − k) ℓ > 0

  • J. McNames

Portland State University ECE 538/638 Autocorrelation

  • Ver. 1.09

9

Solving for a ⎡ ⎢ ⎣ rh(1) rh(0) · · · r∗

h(P − 1)

. . . . . . ... . . . rh(P) rh(P − 1) · · · rh(0) ⎤ ⎥ ⎦ ⎡ ⎢ ⎢ ⎢ ⎣ 1 a1 . . . aP ⎤ ⎥ ⎥ ⎥ ⎦ = ⎡ ⎢ ⎣ . . . ⎤ ⎥ ⎦ ⎡ ⎢ ⎣ rh(1) . . . rh(P) ⎤ ⎥ ⎦ + ⎡ ⎢ ⎣ rh(0) · · · r∗

h(P − 1)

. . . ... . . . rh(P − 1) · · · rh(0) ⎤ ⎥ ⎦ ⎡ ⎢ ⎣ a1 . . . aP ⎤ ⎥ ⎦ = ⎡ ⎢ ⎣ . . . ⎤ ⎥ ⎦ rh + Rha = a = −R−1

h rh

These are called the Yule-Walker equations

  • J. McNames

Portland State University ECE 538/638 Autocorrelation

  • Ver. 1.09

12

AP Equations in Matrix Form We can collect the first P + 1 of these terms in a matrix ⎡ ⎢ ⎢ ⎢ ⎣ rh(0) rh(−1) · · · rh(−P) rh(1) rh(0) · · · rh(−P + 1) . . . . . . ... . . . rh(P) rh(P − 1) · · · rh(0) ⎤ ⎥ ⎥ ⎥ ⎦ ⎡ ⎢ ⎢ ⎢ ⎣ 1 a1 . . . aP ⎤ ⎥ ⎥ ⎥ ⎦ = ⎡ ⎢ ⎢ ⎢ ⎣ |b0|2 . . . ⎤ ⎥ ⎥ ⎥ ⎦ ⎡ ⎢ ⎢ ⎢ ⎣ rh(0) r∗

h(1)

· · · r∗

h(P)

rh(1) rh(0) · · · r∗

h(P − 1)

. . . . . . ... . . . rh(P) rh(P − 1) · · · rh(0) ⎤ ⎥ ⎥ ⎥ ⎦ ⎡ ⎢ ⎢ ⎢ ⎣ 1 a1 . . . aP ⎤ ⎥ ⎥ ⎥ ⎦ = ⎡ ⎢ ⎢ ⎢ ⎣ |b0|2 . . . ⎤ ⎥ ⎥ ⎥ ⎦

  • The autocorrelation matrix is Hermitian, Toeplitz, and positive

definite.

  • J. McNames

Portland State University ECE 538/638 Autocorrelation

  • Ver. 1.09

10

slide-4
SLIDE 4

Yule-Walker Equation Comments Continued a = R−1

h rh

b0 =

  • rh(0) + aTrh
  • Thus the two are equivalent and reversible and unique

characterizations of the model {rh(0), . . . , rh(P)} ↔ {b0, a1, . . . , aP }

  • The rest of the sequence can then be determined by symmetry

and the recursive relation given earlier rh(ℓ) = −

P

  • k=1

akrh(ℓ − k) ℓ > 0 rh(−ℓ) = r∗

h(ℓ)

  • J. McNames

Portland State University ECE 538/638 Autocorrelation

  • Ver. 1.09

15

Solving for b0 ⎡ ⎢ ⎢ ⎢ ⎣ rh(0) r∗

h(1)

· · · r∗

h(P)

rh(1) rh(0) · · · r∗

h(P − 1)

. . . . . . ... . . . rh(P) rh(P − 1) · · · rh(0) ⎤ ⎥ ⎥ ⎥ ⎦ ⎡ ⎢ ⎢ ⎢ ⎣ 1 a1 . . . aP ⎤ ⎥ ⎥ ⎥ ⎦ = ⎡ ⎢ ⎢ ⎢ ⎣ |b0|2 . . . ⎤ ⎥ ⎥ ⎥ ⎦ rh(0) r∗

h(1)

· · · r∗

h(P)

⎡ ⎢ ⎢ ⎢ ⎣ 1 a1 . . . aP ⎤ ⎥ ⎥ ⎥ ⎦ = |b0|2 b0 = ±

  • P
  • k=0

akrh(k) = ±

  • rh(0) + aTrh
  • J. McNames

Portland State University ECE 538/638 Autocorrelation

  • Ver. 1.09

13

AR Processes versus AP Models Concisely, we can write the Yule-Walker Equations as Rha = −rh If we have an AR(P) process, then we know rx(ℓ) = σ2

wrh(ℓ) and we

can equivalently write Rxa = −rx

  • Thus, the following two problems are equivalent

– Find the parameters of an AR process, {a1, . . . , aP , σ2

w}, given

rx(ℓ) – Find the parameters of an AP model, {a1, . . . , aP , b0}, given rh(ℓ)

  • To accommodate both in a common notation, I will write the

Yule-Walker equations as simply Ra = −r

  • J. McNames

Portland State University ECE 538/638 Autocorrelation

  • Ver. 1.09

16

Yule-Walker Equation Comments a = R−1

h rh

b0 = ±

  • rh(0) + aTrh
  • The matrix inverse exists because unless h(n) = 0, Rh is positive

definite

  • Note that we cannot determine the sign of b0 = h(0) from rh(ℓ)
  • Thus, the first P terms of the autocorrelation completely

determine the model parameters

  • A similar relation exists for the first P + 1 elements of the

autocorrelation sequence in terms the model parameters by solving a set of linear equations (Problem 4.6)

  • Is not true for AZ or PZ models
  • J. McNames

Portland State University ECE 538/638 Autocorrelation

  • Ver. 1.09

14

slide-5
SLIDE 5

Partial Autocorrelation: Alternative Definition Define P [x(n)|x(1), . . . , x(n − 1)] as the minimum mean square error linear predictor of x(n) given {x(1), . . . , x(n − 1)} ˆ x(n) = P [x(n)|x(n − 1), . . . , x(1)] =

n−1

  • k=1

ckx(n − k) where ck = argmin

ck

E

  • (x(n) − ˆ

x(n))2 Similarly define P [x(0)|x(1), . . . , x(n − 1)] as the minimum mean square error linear predictor of x(0) given {x(1), . . . , x(n − 1)}, ˆ x(0) = P [x(0)|x(n − 1), . . . , x(1)] =

n−1

  • k=1

dkx(n − k)

  • J. McNames

Portland State University ECE 538/638 Autocorrelation

  • Ver. 1.09

19

Solving for a Recursively We can write the Yule-Walker equations as ⎡ ⎢ ⎢ ⎢ ⎣ r(0) r∗(1) · · · r∗(ℓ − 1) r(1) r(0) · · · r∗(ℓ − 2) . . . . . . ... . . . r(ℓ − 1) r(ℓ − 2) · · · r(0) ⎤ ⎥ ⎥ ⎥ ⎦ ⎡ ⎢ ⎢ ⎢ ⎢ ⎣ a(ℓ)

1

a(ℓ)

2

. . . a(ℓ)

⎤ ⎥ ⎥ ⎥ ⎥ ⎦ = − ⎡ ⎢ ⎢ ⎢ ⎣ r(1) r(2) . . . r(ℓ) ⎤ ⎥ ⎥ ⎥ ⎦ Ra = −r a = −R−1r

  • We can recursively solve for the model coefficients

a = [a(ℓ)

1 , a(ℓ) 2 , . . . , a(ℓ) ℓ ] for increasing model orders

  • Levinson-Durbin algorithm
  • J. McNames

Portland State University ECE 538/638 Autocorrelation

  • Ver. 1.09

17

Partial Autocorrelation: Alternative Definition & Properties Then the PACF can be defined as the correlation between the residuals ˜ xn(n)

  • x(n) − ˆ

x1:n−1(n) = x(n) − P [x(n)|x(n − 1), . . . , x(1)] ˜ xn(0)

  • x(0) − ˆ

x1:n−1(0) = x(0) − P [x(0)|x(n − 1), . . . , x(1)] α(ℓ)

  • E [(x(ℓ) − ˆ

xn(ℓ)) (x(0) − ˆ xn(0))] E

  • (x(0) − ˆ

xn(0))2 = E [(x(ℓ) − ˆ xn(ℓ)] (x(0) − ˆ xn(0))] E

  • (x(n) − ˆ

xn(n))2

  • One can think of the PACF as a measure of the correlation of

what has not already been explained (the residuals)

  • Like the ACF, it depends only on second order properties
  • J. McNames

Portland State University ECE 538/638 Autocorrelation

  • Ver. 1.09

20

Partial Autocorrelation Partial Autocorrelation Function (PACF) also known as, the partial autocorrelation sequence (PACS), is defined as α(ℓ) ⎧ ⎪ ⎨ ⎪ ⎩ 1 ℓ = 0 a(ℓ)

ℓ > 0 α∗(−ℓ) ℓ < 0 where a(ℓ)

is the last element of a ∈ Rℓ and is given by the Yule-Walker equations R

  • ℓ×ℓ

a

  • ℓ×1

= − r

  • ℓ×1
  • It is a dual of the ACF and has a number of useful and

complimentary properties

  • J. McNames

Portland State University ECE 538/638 Autocorrelation

  • Ver. 1.09

18

slide-6
SLIDE 6

Example 3: MA(1) ACF

1 2 3 4 5 6 7 8 9 10 −1 −0.8 −0.6 −0.4 −0.2 0.2 0.4 0.6 0.8 1 ρ(l) Lag (l)

  • J. McNames

Portland State University ECE 538/638 Autocorrelation

  • Ver. 1.09

23

Partial Autocorrelation Properties & Intuiting α(ℓ) ⎧ ⎪ ⎨ ⎪ ⎩ 1 ℓ = 0 a(ℓ)

ℓ > 0 α∗(−ℓ) ℓ < 0

  • Intuitively you might expect |α(ℓ)| < |ρ(ℓ)|, but this is not true in

general

  • Like ρ(ℓ), the PACF is bounded: −1 ≤ α(ℓ) ≤ 1
  • White noise, x(n) ∼ WN(0, σ2

x): ρx(ℓ) = δ(ℓ)

  • The PACF of a AR(P) process is finite: αx(ℓ) = 0 for ℓ > P
  • Thus, if the estimated PACF is very small for large lags a AR(P)

model may be appropriate

  • Surprisingly, the PACF is an infinite sequence for MA(Q)

processes and ARMA(P, Q) processes

  • J. McNames

Portland State University ECE 538/638 Autocorrelation

  • Ver. 1.09

21

Example 3: MATLAB Code

L = 10; % Length of autocorrelation calculated b1 = 0.9; % Coefficient sw = 1; % White noise power ac = sw*[(1+b1^2);b1;zeros(L-1,1)]; % Autocovariance = autocorrelation l = 0:L; acf = ac/ac(1); h = stem(l,acf); set(h(1),’MarkerFaceColor’,’b’); set(h(1),’MarkerSize’,4); ylabel(’\rho(l)’); xlabel(’Lag (l)’); xlim([0 L]); ylim([-1 1]); box off;

  • J. McNames

Portland State University ECE 538/638 Autocorrelation

  • Ver. 1.09

24

Example 3: MA(1) ACF and PACF Plot the ACF and PACF of a MA(1) model with b1 = 0.9. Hint: the true PACF is given by α(ℓ) = (−b1)ℓ(1 − b2

1)

1 − b2(ℓ+1)

1

  • J. McNames

Portland State University ECE 538/638 Autocorrelation

  • Ver. 1.09

22

slide-7
SLIDE 7

Example 3: Relevant MATLAB Code Continued

l = 0:L; h = stem(l,pc); set(h(1),’MarkerFaceColor’,’b’); set(h(1),’MarkerSize’,4); ylabel(’\alpha(l)’); xlabel(’Lag (l)’); xlim([0 L]); ylim([-1 1]); box off;

  • J. McNames

Portland State University ECE 538/638 Autocorrelation

  • Ver. 1.09

27

Example 3: MA(1) PACF

1 2 3 4 5 6 7 8 9 10 −1 −0.8 −0.6 −0.4 −0.2 0.2 0.4 0.6 0.8 1 α(l) Lag (l)

  • J. McNames

Portland State University ECE 538/638 Autocorrelation

  • Ver. 1.09

25

Example 4: AR(1) ACF and PACF Plot the ACF and PACF of a AR(1) process with a = [1 0.9].

  • J. McNames

Portland State University ECE 538/638 Autocorrelation

  • Ver. 1.09

28

Example 3: Relevant MATLAB Code

pc = zeros(L+1,1); mc = zeros(L+1,1); pv = zeros(L+1,1); pc(1) = 1; mc(1) = 1; pv(1) = ac(1); pc(2) = ac(2)/ac(1); mc(2) = pc(2); pv(2) = ac(1)*(1-pc(2).^2); for c1 = 3:L+1, pc(c1 ) = (ac(c1) - mc(2:c1-1).’*ac((c1-1):-1:2))/pv(c1-1); mc(2:c1-1) = mc(2:c1-1) - pc(c1)*mc(c1-1:-1:2); mc(c1 ) = pc(c1); pv(c1 ) = pv(c1-1)*(1-pc(c1).^2); end;

  • J. McNames

Portland State University ECE 538/638 Autocorrelation

  • Ver. 1.09

26

slide-8
SLIDE 8

Example 4: AR(1) PACF

1 2 3 4 5 6 7 8 9 10 −1 −0.8 −0.6 −0.4 −0.2 0.2 0.4 0.6 0.8 1 α(l) Lag (l)

  • J. McNames

Portland State University ECE 538/638 Autocorrelation

  • Ver. 1.09

31

Example 4: AR(1) ACF

1 2 3 4 5 6 7 8 9 10 −1 −0.8 −0.6 −0.4 −0.2 0.2 0.4 0.6 0.8 1 ρ(l) Lag (l)

  • J. McNames

Portland State University ECE 538/638 Autocorrelation

  • Ver. 1.09

29

Autocovariance Estimation

  • We’ve seen that the second-order statistics are a handy, though

incomplete, characterization of WSS stochastic processes

  • We would like to estimate these properties from realizations

– Single signal: γx(ℓ), rx(ℓ), αx(ℓ), Rx(ejω) – Two or more signals: γyx(ℓ), ryx(ℓ), Ryx(ℓ), G2

yx(ejω)

  • What are the best estimators?
  • J. McNames

Portland State University ECE 538/638 Autocorrelation

  • Ver. 1.09

32

Example 4: Relevant MATLAB Code

L = 10; % Length of autocorrelation calculated a1 = 0.9; % Coefficient sw = 1; % White noise power ac = zeros(L+1,1); ac(1) = sw/(1-a1^2); for c1=2:L+1, ac(c1) = -a1*ac(c1-1); end;

  • J. McNames

Portland State University ECE 538/638 Autocorrelation

  • Ver. 1.09

30

slide-9
SLIDE 9

Unbiased Autocovariance Estimation ˆ γu(ℓ) 1 N − |ℓ|

N−1−|ℓ|

  • n=0

[x(n + |ℓ|) − ˆ µx] [x(n) − ˆ µx]

  • If we used the true mean µx instead of ˆ

µx, ˆ γu(ℓ) would be unbiased

  • When we use ˆ

µx the estimate is asymptotically unbiased

  • The bias is O(1/N)
  • Much smaller than the variance, so it may be ignored
  • J. McNames

Portland State University ECE 538/638 Autocorrelation

  • Ver. 1.09

35

Autocovariance Estimation Options In practical applications, we only have a real finite data record {x(n)}N−1 . There are two popular estimators of autocovariance worth considering: “unbiased” and biased. “Unbiased” ˆ γu(ℓ) 1 N − |ℓ|

N−1−|ℓ|

  • n=0

[x(n + |ℓ|) − ˆ µx] [x(n) − ˆ µx] |ℓ| < N and ˆ γu(ℓ) = 0 for |ℓ| ≥ N. Here ˆ µx is the sample average of the sequence defined as ˆ µx 1 N

N−1

  • n=0

x(n)

  • J. McNames

Portland State University ECE 538/638 Autocorrelation

  • Ver. 1.09

33

Biased Autocovariance Estimation ˆ γb(ℓ)

  • 1

N

N−1−|ℓ|

  • n=0

[x(n + |ℓ|) − ˆ µx] [x(n) − ˆ µx] |ℓ| < N = N − |ℓ| N ˆ γu(ℓ)

  • Our book (and most other books) lists a different estimate
  • This estimate uses a divisor of N rather than (N − |ℓ|)
  • If we ignore the effect of estimating µx, this bias is obvious

E [ˆ γ(ℓ)] = N − |ℓ| N γ(ℓ)

  • The bias of this estimator is larger than the “unbiased” estimator
  • Some claim that in general, the “biased” estimator has a smaller

MSE

  • The variance, must therefore be much smaller
  • J. McNames

Portland State University ECE 538/638 Autocorrelation

  • Ver. 1.09

36

Unbiased Autocovariance Estimation ˆ γu(ℓ) 1 N − |ℓ|

N−1−|ℓ|

  • n=0

[x(n + |ℓ|) − ˆ µx] [x(n) − ˆ µx]

  • Discussed briefly in the book
  • The estimate has even symmetry: ˆ

γu(ℓ) = ˆ γu(−ℓ)

  • At longer lags, we have fewer terms to estimate the autocovariance
  • We have no way to estimate γ(ℓ) for |ℓ| ≥ N
  • We know that each pair {x(n + |ℓ|), x(n)} for all n have the same

distribution because the process is assumed WSS and ergodic

  • This is a natural estimator that we know converges asymptotically

(N → ∞)

  • J. McNames

Portland State University ECE 538/638 Autocorrelation

  • Ver. 1.09

34

slide-10
SLIDE 10

Biased versus Unbiased Estimators ˆ γb(ℓ) = N − |ℓ| N ˆ γu(ℓ) ∝

N−1−|ℓ|

  • n=0

[x(n + |ℓ|) − ˆ µx] [x(n) − ˆ µx]

  • Although ˆ

γb(ℓ) is biased, – The bias is small at small lags – For large lags, the bias is towards 0: ˆ γ(ℓ) → 0 as ℓ → ∞ – This is also a property of the true autocorrelation

  • If γ(ℓ) is small for large lags, then the bias is also small
  • The biased estimator has considerably less variance at large lags

(the tail) Biased var{ˆ γb(ℓ)} = O(1/N) Unbiased var{ˆ γu(ℓ)} = O(1/(N − |ℓ|))

  • J. McNames

Portland State University ECE 538/638 Autocorrelation

  • Ver. 1.09

39

Biased versus Unbiased Estimators ˆ γb(ℓ) = N − |ℓ| N ˆ γu(ℓ) ∝

N−1−|ℓ|

  • n=0

[x(n + |ℓ|) − ˆ µx] [x(n) − ˆ µx]

  • The estimators are often called the sample autocovariance

functions

  • Most software and books prefer the biased estimate
  • Why prefer a biased estimate to an unbiased estimate?
  • Our goal is to estimate the sequence, not just γ(ℓ) for a specific

lag ℓ

  • J. McNames

Portland State University ECE 538/638 Autocorrelation

  • Ver. 1.09

37

Biased is Better? ˆ γb(ℓ) = N − |ℓ| N ˆ γu(ℓ) ∝

N−1−|ℓ|

  • n=0

[x(n + |ℓ|) − ˆ µx] [x(n) − ˆ µx]

  • In general

– At small lags, there is little difference between the two estimators – At large lags, the larger bias of the biased model is favorably traded for reduced variance

  • In most cases, the biased model has smaller MSE, though it has

not been proven rigorously

  • For the remainder of the class will use the biased estimator, unless
  • therwise noted ˆ

γ(ℓ) = ˆ γb(ℓ)

  • J. McNames

Portland State University ECE 538/638 Autocorrelation

  • Ver. 1.09

40

Biased versus Unbiased Estimators ˆ γb(ℓ) = N − |ℓ| N ˆ γu(ℓ) ∝

N−1−|ℓ|

  • n=0

[x(n + |ℓ|) − ˆ µx] [x(n) − ˆ µx]

  • The key advantage of ˆ

γb(ℓ) is that it is positive semi-definite (i.e., nonnegative definite)

  • There are many reasons why this property is important

– We know the true autocovariance has this property – Autoregressive models built with the positive-definite estimates

  • f γ(ℓ) are stable

– Most estimators of power spectral density R(ejω) are nonnegative if they are based on a positive-definite estimate of γ(ℓ)

  • ˆ

γu(ℓ) may be positive definite for a particular sequence, but it is not guaranteed in general

  • J. McNames

Portland State University ECE 538/638 Autocorrelation

  • Ver. 1.09

38

slide-11
SLIDE 11

Estimated Autocorrelation Variance Continued If Gaussian random process, var{ˆ rb(ℓ)} = 1 N

N−ℓ−1

  • m=−(N+ℓ)+1
  • N−|m|+ℓ

N

r2(m) + r(m + ℓ)r(m − ℓ)

  • The same applies to the unbiased estimate with a divisor of

1/(N − |ℓ|) instead of 1/N

  • This is still problematic because we don’t know the true r(ℓ) in

most applications

  • If we did, we wouldn’t need to estimate it!
  • This is often what prevents us from making desired inferences

about our estimators: – Desired properties of the sampling distribution depend on unknown properties of the random process

  • J. McNames

Portland State University ECE 538/638 Autocorrelation

  • Ver. 1.09

43

Estimated Autocorrelation Covariance ˆ γb(ℓ) = N − |ℓ| N ˆ γu(ℓ) ∝

N−1−|ℓ|

  • n=0

[x(n + |ℓ|) − ˆ µx] [x(n) − ˆ µx]

  • As with all estimators, we would like to have confidence intervals
  • These are hard to obtain, in general
  • Need more assumptions

– Stationary up to order four E [x(n)x(n + k)x(n + ℓ)x(n + m)] = f(k, ℓ, m) – Mean is zero µx = 0, so does not need to be estimated

  • J. McNames

Portland State University ECE 538/638 Autocorrelation

  • Ver. 1.09

41

Estimated ACF The natural estimate of the ACF is ˆ ρb(ℓ) ˆ γb(ℓ) ˆ γ(0) ˆ ρu(ℓ) ˆ γu(ℓ) ˆ γ(0)

  • Same tradeoffs exist between the biased and unbiased estimates
  • Also

– |ˆ ρb(ℓ)| ≤ 1 for all ℓ – Not true in general for ˆ ρu(ℓ)

  • They are the same at ℓ = 0
  • Often called the sample autocorrelation function
  • Again, the bias, covariance, and variance of the estimators is

complicated and based on unknown properties

  • J. McNames

Portland State University ECE 538/638 Autocorrelation

  • Ver. 1.09

44

Estimated Autocorrelation Variance ˆ γb(ℓ) = ˆ rb(ℓ) = 1 N

N−1−|ℓ|

  • n=0

x(n + |ℓ|)x(n) ˆ γu(ℓ) = ˆ ru(ℓ) = 1 N − |ℓ|

N−1−|ℓ|

  • n=0

x(n + |ℓ|)x(n)

  • The bias is

E [ˆ rb(ℓ)] = N − |ℓ| N r(ℓ) E [ˆ ru(ℓ)] = r(ℓ)

  • The covariance of ˆ

r(ℓ) is complicated and not usable in practice – Depends on fourth joint cumulant of {x(n), x(n + k), x(n + ℓ), x(n + m)} – Depends on true unknown autocorrelation

  • If process is Gaussian, then the fourth joint cumulant is zero
  • J. McNames

Portland State University ECE 538/638 Autocorrelation

  • Ver. 1.09

42

slide-12
SLIDE 12

Confidence Intervals

  • If N is large enough, the central limit theorem applies and ˆ

ρb(ℓ) is approximately normal

  • In this case, we can use the Normal cdf to plot confidence

intervals of an IID sequence

  • These are proportional to ±
  • var{ˆ

ρb(ℓ)}

  • J. McNames

Portland State University ECE 538/638 Autocorrelation

  • Ver. 1.09

47

Estimated ACF Variance Again, if x(n) is a Guassian process then var{ˆ ρb(ℓ)} ≈ 1 N

  • m=−∞

ρ2(m) + ρ(m + ℓ)ρ(m − ℓ) + 2ρ2(ℓ)ρ2(m) − 4ρ(ℓ)ρ(m)ρ(m − ℓ)

  • The fourth cumulant is also absent if x(n) is generated by a linear

process with independent inputs

  • The sample ACF, ˆ

ρ(ℓ) will generally have more correlation than the true ρ(ℓ)

  • It will generally be less damped and decay more slowly than ρ(ℓ)
  • Applies to the estimated autocovariance and autocorrelations as

well

  • J. McNames

Portland State University ECE 538/638 Autocorrelation

  • Ver. 1.09

45

Partial Autocorrelation Estimation

  • There are similar issues surrounding partial autocorrelation
  • However, in this case we always use the biased estimate of

autocorrelation to estimate the PACF

  • This is necessary, in this case, to ensure that the AR models are

bounded

  • Less is known about the statistics of the PACF (mean, variance,

and confidence intervals)

  • However, for reasons similar to that of the ACF, for a WN process

the CLT applies and we can use the same confidence intervals as for the ACF

  • J. McNames

Portland State University ECE 538/638 Autocorrelation

  • Ver. 1.09

48

Confidence Intervals Let x(n) be an IID sequence. Then ρ(0) = 1 ρ(ℓ) = |ℓ| > 0 cov{ˆ ρ(ℓ), ˆ ρ(ℓ + m)} ≈ m = 0 var{ˆ ρb(ℓ)} ≈ 1 N |ℓ| > 0 var{ˆ ρu(ℓ)} ≈ N (N − |ℓ|)2 |ℓ| > 0

  • In general, it is not possible to obtain confidence intervals for the

estimated ACF because the variance of the estimator depends on the true ACF

  • Instead, it is common practice to plot the confidence intervals of a

purely random process

  • J. McNames

Portland State University ECE 538/638 Autocorrelation

  • Ver. 1.09

46

slide-13
SLIDE 13

Example 5: AR(1) ACF

10 20 30 40 50 60 70 80 90 −1 −0.5 0.5 1 Lag (l) N=100 a1=−0.9 ρ(l)

  • J. McNames

Portland State University ECE 538/638 Autocorrelation

  • Ver. 1.09

51

Example 5: 1st Order Autoregressive Find the autocorrelation function of a 1st order autoregressive process, AR(1): x(n) = −a1x(n − 1) + w(n) where w(n) ∼ WN(0, σ2

w). Estimate the ACF using the biased and

unbiased estimates for N = 100. Do so several times for different values of a1.

  • J. McNames

Portland State University ECE 538/638 Autocorrelation

  • Ver. 1.09

49

Example 5: AR(1) ACF

10 20 30 40 50 60 70 80 90 −1 −0.5 0.5 1 Lag (l) N=100 a1=−0.9 ρ(l)

  • J. McNames

Portland State University ECE 538/638 Autocorrelation

  • Ver. 1.09

52

Example 5: AR(1) Signal

10 20 30 40 50 60 70 80 90 100 −1 1 2 3 4 5 6 Sample (n) N=100 a1=−0.9 x(n)

  • J. McNames

Portland State University ECE 538/638 Autocorrelation

  • Ver. 1.09

50

slide-14
SLIDE 14

Example 5: AR(1) ACF

10 20 30 40 50 60 70 80 90 −1 −0.5 0.5 1 Lag (l) N=100 a1=0.0 ρ(l)

  • J. McNames

Portland State University ECE 538/638 Autocorrelation

  • Ver. 1.09

55

Example 5: AR(1) PACF

10 20 30 40 50 60 70 80 90 −1 −0.5 0.5 1 Lag (l) N=100 a1=−0.9 α(l)

  • J. McNames

Portland State University ECE 538/638 Autocorrelation

  • Ver. 1.09

53

Example 5: AR(1) ACF

10 20 30 40 50 60 70 80 90 −1 −0.5 0.5 1 Lag (l) N=100 a1=0.0 ρ(l)

  • J. McNames

Portland State University ECE 538/638 Autocorrelation

  • Ver. 1.09

56

Example 5: AR(1) Signal

10 20 30 40 50 60 70 80 90 100 −2.5 −2 −1.5 −1 −0.5 0.5 1 1.5 2 Sample (n) N=100 a1=0.0 x(n)

  • J. McNames

Portland State University ECE 538/638 Autocorrelation

  • Ver. 1.09

54

slide-15
SLIDE 15

Example 5: AR(1) ACF

10 20 30 40 50 60 70 80 90 −1 −0.5 0.5 1 Lag (l) N=100 a1=0.5 ρ(l)

  • J. McNames

Portland State University ECE 538/638 Autocorrelation

  • Ver. 1.09

59

Example 5: AR(1) PACF

10 20 30 40 50 60 70 80 90 −1 −0.5 0.5 1 Lag (l) N=100 a1=0.0 α(l)

  • J. McNames

Portland State University ECE 538/638 Autocorrelation

  • Ver. 1.09

57

Example 5: AR(1) ACF

10 20 30 40 50 60 70 80 90 −1 −0.5 0.5 1 Lag (l) N=100 a1=0.5 ρ(l)

  • J. McNames

Portland State University ECE 538/638 Autocorrelation

  • Ver. 1.09

60

Example 5: AR(1) Signal

10 20 30 40 50 60 70 80 90 100 −2 −1 1 2 Sample (n) N=100 a1=0.5 x(n)

  • J. McNames

Portland State University ECE 538/638 Autocorrelation

  • Ver. 1.09

58

slide-16
SLIDE 16

Example 5: AR(1) ACF

10 20 30 40 50 60 70 80 90 −1 −0.5 0.5 1 Lag (l) N=100 a1=0.9 ρ(l)

  • J. McNames

Portland State University ECE 538/638 Autocorrelation

  • Ver. 1.09

63

Example 5: AR(1) PACF

10 20 30 40 50 60 70 80 90 −1 −0.5 0.5 1 Lag (l) N=100 a1=0.5 α(l)

  • J. McNames

Portland State University ECE 538/638 Autocorrelation

  • Ver. 1.09

61

Example 5: AR(1) ACF

10 20 30 40 50 60 70 80 90 −1 −0.5 0.5 1 Lag (l) N=100 a1=0.9 ρ(l)

  • J. McNames

Portland State University ECE 538/638 Autocorrelation

  • Ver. 1.09

64

Example 5: AR(1) Signal

10 20 30 40 50 60 70 80 90 100 −5 5 Sample (n) N=100 a1=0.9 x(n)

  • J. McNames

Portland State University ECE 538/638 Autocorrelation

  • Ver. 1.09

62

slide-17
SLIDE 17

Summary

  • ACF and PACF are useful characterizations of WSS random

processes

  • Can help select an appropriate model

– MA: Finite ACF – AR: Finite PACF

  • AP/AR are often preferred characterizations because we can

solve/estimate the model parameters by solving a set of linear equations (Yule-Walker)

  • Biased estimates of r(ℓ), ρ(ℓ), and/or γ(ℓ) are generally preferred

to the unbiased estimates – Less variance (always), and lower MSE (sometimes) – Positive definite (PSD is therefore also nonnegative)

  • Bias is known, but variance of estimates is generally unknown
  • Loosely, confidence intervals for WN are used instead
  • J. McNames

Portland State University ECE 538/638 Autocorrelation

  • Ver. 1.09

67

Example 5: AR(1) PACF

10 20 30 40 50 60 70 80 90 −1 −0.5 0.5 1 Lag (l) N=100 a1=0.9 α(l)

  • J. McNames

Portland State University ECE 538/638 Autocorrelation

  • Ver. 1.09

65

Example 5: MATLAB Code

L = 90; % Length of autocorrelation calculated a1 = 0.9; % Coefficient sw = 1; % White noise power ac = zeros(L+1,1); N = 100; cl = 99; % Confidence level np = norminv((1-cl/100)/2); % Find corresponding lower percentile ac(1) = sw/(1-a1^2); for c1=2:L+1, ac(c1) = -a1*ac(c1-1); end; acf = ac/ac(1); w = randn(N,1); a = [1 a1]; x = filter(1,a,w);

  • J. McNames

Portland State University ECE 538/638 Autocorrelation

  • Ver. 1.09

66