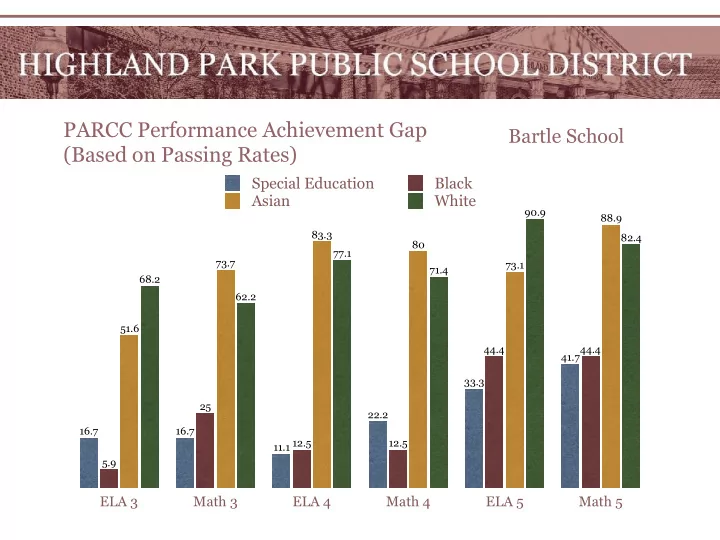
parcc performance achievement gap
play

PARCC Performance Achievement Gap Bartle School (Based on Passing - PowerPoint PPT Presentation

PARCC Performance Achievement Gap Bartle School (Based on Passing Rates) Special Education Black Asian White 90.9 88.9 83.3 82.4 80 77.1 73.7 73.1 71.4 68.2 62.2 51.6 44.4 44.4 41.7 33.3 25 22.2 16.7 16.7 12.5 12.5 11.1


  1. PARCC Performance Achievement Gap Bartle School (Based on Passing Rates) Special Education Black Asian White 90.9 88.9 83.3 82.4 80 77.1 73.7 73.1 71.4 68.2 62.2 51.6 44.4 44.4 41.7 33.3 25 22.2 16.7 16.7 12.5 12.5 11.1 5.9 ELA 3 Math 3 ELA 4 Math 4 ELA 5 Math 5

  2. PARCC Participation Rates by Subgroup Bartle School (percentage) Special Education Black Asian White 100 100 100 100 96 95 94 89 89 86 86 85 85 83 83 83 83 82 82 78 75 75 69 69 ELA 3 Math 3 ELA 4 Math 4 ELA 5 Math 5

  3. PARCC Performance Achievement Gap Middle School (Based on Passing Rates) Special Education Black Asian White 92.6 81.5 81.3 66.7 60 55.6 53.8 44 37.5 33.3 33.3 30 25 20 20 20 9.1 6.7 0 0 0 0 0 0 ELA 6 Math 6 ELA 7 Math 7 ELA 8 Math 8

  4. PARCC Participation Rates by Subgroup Middle School (percentage) Special Education Black Asian White 100 100 100 88.2 88.2 88 87 86.7 84 69.2 66.7 63.6 63.6 61.5 60 55.6 55.6 46.2 43.5 43.5 38.5 36.4 33.4 30.8 ELA 6 Math 6 ELA 7 Math 7 ELA 8 Math 8

  5. PARCC Performance Achievement Gap High School (Based on Passing Rates) Special Education Black Asian White 82.8 80.9 79.5 78.1 75 73.3 64.3 62.5 50 47.5 45.8 42.9 33.3 30.8 30 25 16.7 16.7 15 11.1 10 7.7 6.3 0 ELA 9 ELA 10 ELA 11 Algebra I Algebra II Geometry

  6. PARCC Participation Rates by Subgroup High School (percentage) Special Education Black Asian White 100 100 100 96.7 96.7 95.2 94.1 92.9 90.9 88.9 88.9 88.2 87 85.7 79.6 76.9 76.9 76.1 75 72.7 72 69.2 66.7 62.1 ELA 9 ELA 10 ELA 11 Algebra I Algebra II Geometry

  7. MAP Data- Fall 2016 Middle School Black Asian White 254 248 238 236 235 231 230 229 227 227 226 223 219 219 218 215 212 207 ELA 6 Math 6 ELA 7 Math 7 ELA 8 Math 8

  8. MAP Grade Level Norms

  9. Assumptions Bartle PARCC participation rates may not skew performance results Middle school PARCC participation rates do skew performance results High school PARCC participation rates do skew performance results

  10. Assumptions -Some difference between special Bartle PARCC participation rates do not skew education and Asian/white performance results -Grade 3 black participation rate high Middle school PARCC participation rates do -Grade 6, 8 Asian/white participation rates low skew performance results High school PARCC participation rates do -Special education rates relatively high skew performance results

  11. Interventions Irving ELA interventions elevated and more comprehensive Bartle ELA “common language” and consistency, including language intervention strategies Middle school now includes structured interventions K-5 math program being evaluated for effectiveness

  12. Interventions Dedicated focus on cultural responsiveness Renewed social-emotional well-being Greater exposure to rigorous curricula

Download Presentation
Download Policy: The content available on the website is offered to you 'AS IS' for your personal information and use only. It cannot be commercialized, licensed, or distributed on other websites without prior consent from the author. To download a presentation, simply click this link. If you encounter any difficulties during the download process, it's possible that the publisher has removed the file from their server.

Recommend


More recommend